Figures & data
Figure 1. SST RMSD (°C) with respect to OSTIA [(a) and (b)] and SLA correlation with respect to AVISO [(c) and (d)] for RODAS analyses and the free run from 1 January 2011 to 31 December 2012. The black contour represents 0.6 correlation.
![Figure 1. SST RMSD (°C) with respect to OSTIA [(a) and (b)] and SLA correlation with respect to AVISO [(c) and (d)] for RODAS analyses and the free run from 1 January 2011 to 31 December 2012. The black contour represents 0.6 correlation.](/cms/asset/30aa9172-b2d8-4892-8717-c7db31167e09/tjoo_a_1606880_f0001_oc.jpg)
Figure 2. Vertical mean profiles of RMSD with respect to Argo T/S data from 1 January 2011 to 31 December 2012 for temperature (°C) and salinity over Metarea V.
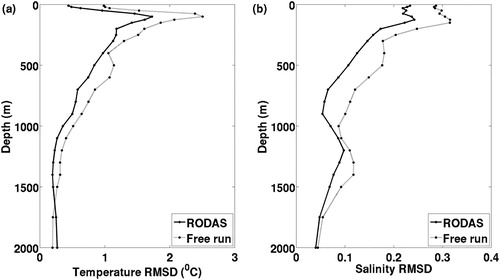
Figure 3. RMSD and correlation of SST and SLA with respect to RODAS analyses over 48 30-day cycles averaged over Metarea V. Black solid line represents the hindcast, the line with square markers represents persistence and the line with asterisk markers represents the free run.
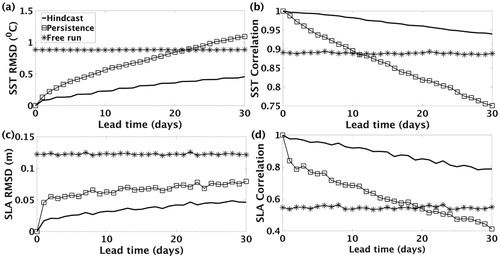
Figure 4. RMSD of the subsurface temperature (°C) [(a) and (b)] and salinity [(c) and (d)] with respect to RODAS over 48 30-day cycles averaged in Metarea V.
![Figure 4. RMSD of the subsurface temperature (°C) [(a) and (b)] and salinity [(c) and (d)] with respect to RODAS over 48 30-day cycles averaged in Metarea V.](/cms/asset/c6440387-21ec-4369-9ab4-143eb1c9bff7/tjoo_a_1606880_f0004_oc.jpg)
Figure 5. SST (°C) [(a) to (d)] and SLA (m) [(e) to (h)] fields during an upwelling event on 23 February 2011. The solid black line represents the position of the vertical section. The black dashed lines represent the 100 and 1000 m isobaths.
![Figure 5. SST (°C) [(a) to (d)] and SLA (m) [(e) to (h)] fields during an upwelling event on 23 February 2011. The solid black line represents the position of the vertical section. The black dashed lines represent the 100 and 1000 m isobaths.](/cms/asset/6e8a89df-a6e1-4761-a12a-0cd2569942ef/tjoo_a_1606880_f0005_oc.jpg)
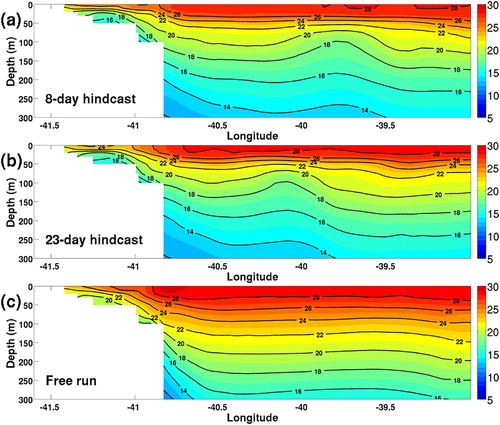
Figure 6. Vertical sections of temperature (°C) during an upwelling event on 23 February 2011. The location of the section is shown in .