Figures & data
Figure 1. Mormugao port general view on Indian map.
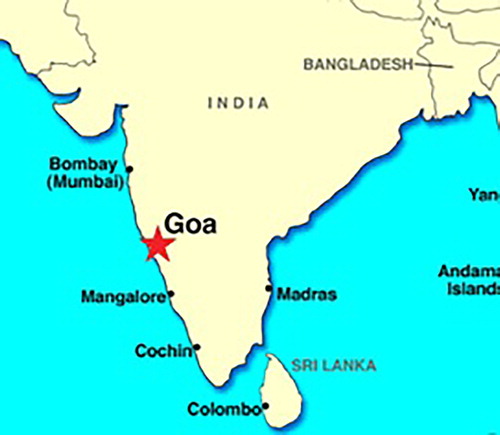
Figure 2. Hydrophone deployment location and Mormugao port ship traffic lane. Map obtained from Marine traffic.com website.
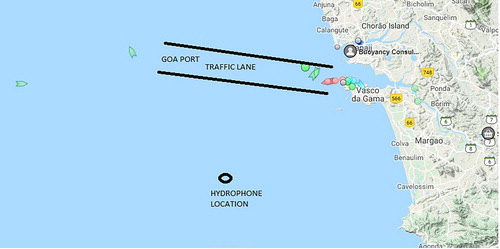
Table 1. Hydrophone specifications.
Table 2. Data collected period.
Table 3. Meteorological data.
Figure 3. Ocean noise levels spectrum indicating peak noise levels at 6.7 kHz.
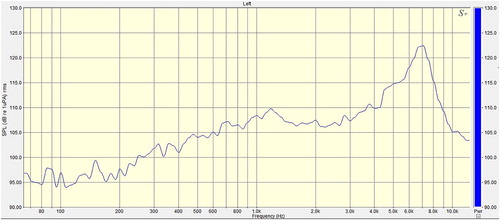
Figure 4. The peak sound pressure levels (SPL) histograms indicating the noise levels occurrences in a month (A) May (B) June.
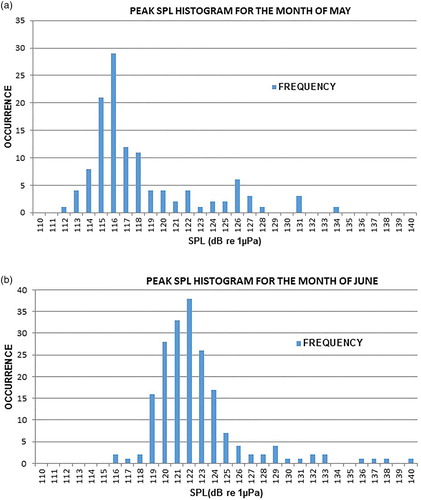
Figure 5. Comparison of ship noise and ambient noise spectrums in the frequency range up to 6 kHz.
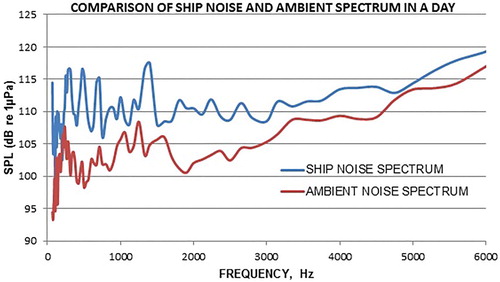
Figure 6. Ship noise 1/12 octave frequency spectrum from a dataset with 30-sec duration in a day.
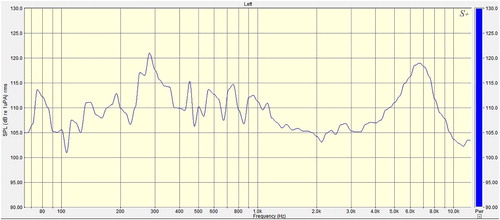
Figure 7. Low-frequency day-wise shipping noise levels (A) May (B) June.
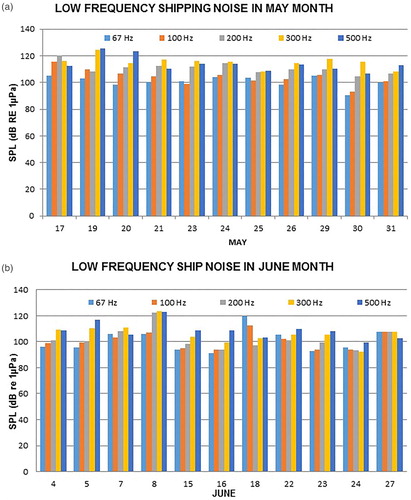
Figure 8. Range of sound levels of ship datasets for both May and June months.
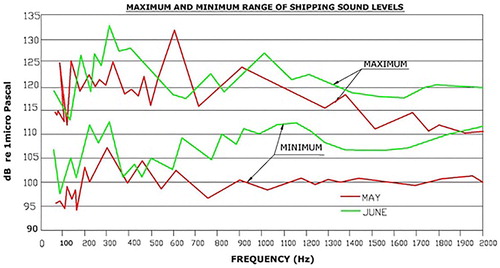
Figure 9. The Fish noise spectrogram indicating the disturbances in (A) High frequency (B) low frequency.
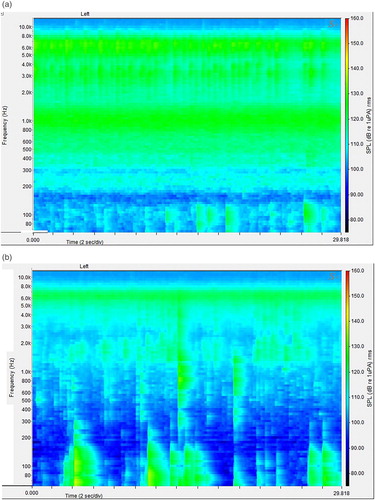
Figure 10 . The Ocean noise spectrogram indicating the ambient and ship passage disturbance (A) Ambient on 19 May 2012 at 10:00 AM (B) Ship disturbance 19 May 2012 at 4:00 AM.
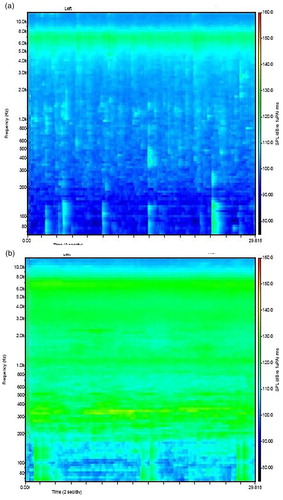
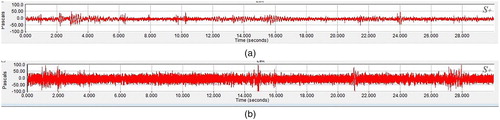
Figure 11. The time series representation of ocean noise levels for the 30-sec duration (C) Ambient 19th May 2012 at 10:00 AM (D). Ship disturbance 19 May 2012 at 4:00 AM.