
Figures & data
Figure 1. Conceptual diagram of SIMA information platform showing user-level functionality and the SIMA model and databases to be implemented.
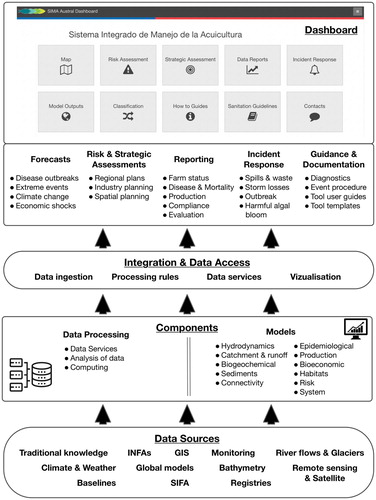
Figure 2. Application of SIMA components to use cases defined by carrying capacity.
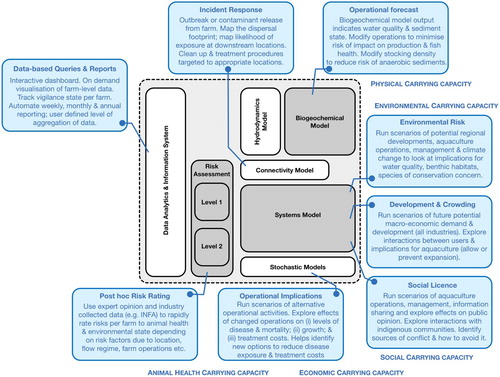
Figure 3. Map of southern Chile showing the extent of environmental and ecosystem models, and the occurrence of salmonid and mussel farming leases. The inset of the Los Lagos Region also shows stream gauge and water quality monitoring stations.
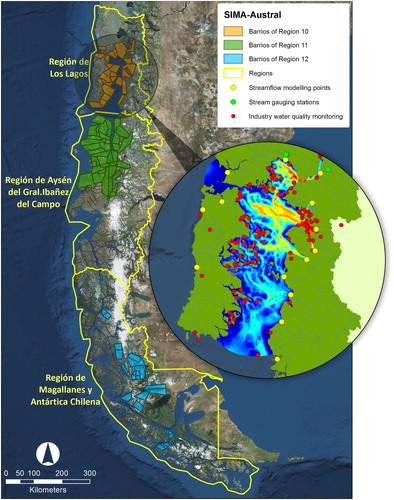
Figure 4. Schematic of the three-tiered risk assessment framework implemented for SIMA Austral, showing the two levels of assessment – semi-quantitative (using simple metrics by impact factors) and the fully dynamic quantitative models and the various levels of responses and outputs.
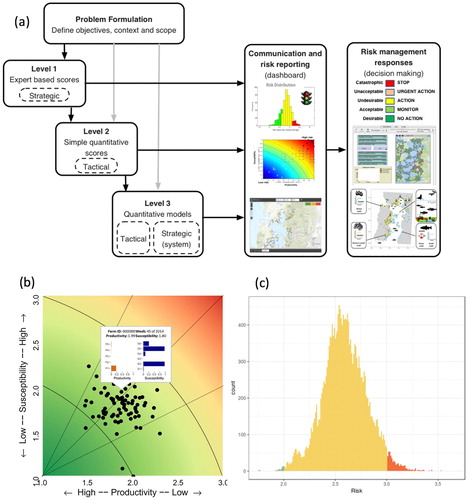
Figure 5. Schematic showing components of environmental and systems models colour-coded according to modelling approach.
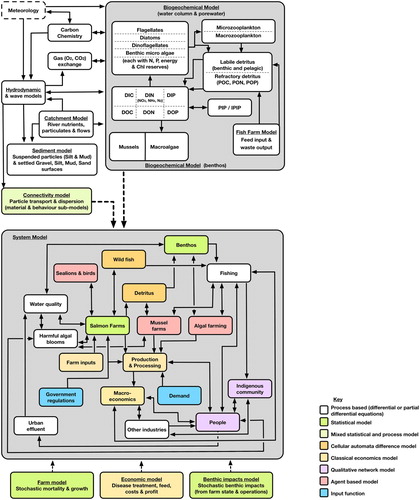
Figure 6. Hydrodynamic model output of the Los Lagos region showing mean (left) summer and winter (right) salinity with vectors representing surface velocity.
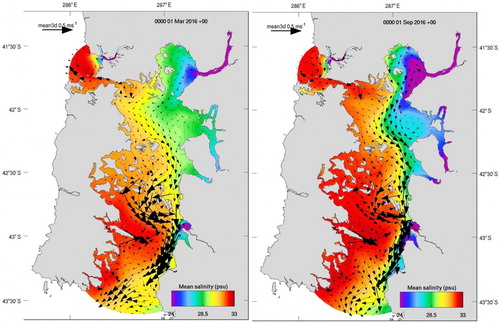
Figure 7. Schematic of the SIMA-Austral platform, which brings together data and models through a suite of data systems, data services and interactive visualisation tools.
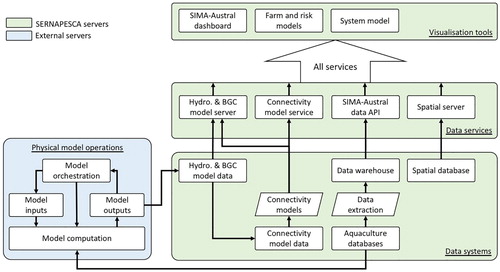
Figure 8. Example Environmental Model output showing (a) median distributions of tracer due (in kg m−3) to the release of 1 kg s−1 flux into the surface at a western (a) and eastern (b) site and (c) four sites across the model domain; (d) surface dissolved inorganic nitrogen (e) total chlorophyll and (f) surface water true colour.
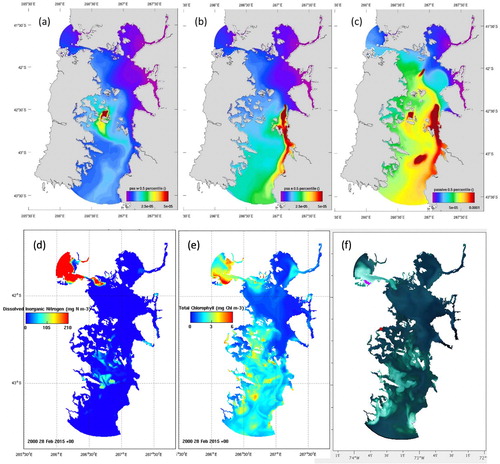
Figure 9. (a) Example of output showing modelled dispersal of sea lice released from a central-eastern island of the Gulf of Ancud in the Los Lagos Region over the period October to December 2016. Dark red indicates more than 10% of the release passed through the grid cell, green 40-60% and dark blue less than 10%. (b) Computed flushing timescales for barrios in the Los Lagos Region. These equate to the average time for concentrations within a barrio to fall to e-1 = 0.368 of their starting value. Longer flushing times typically increase the risk of contaminant accumulation and associated deterioration in water quality.
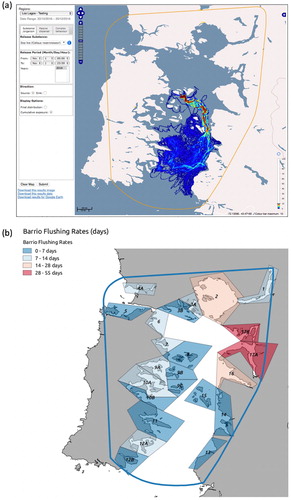
Figure 10. Two examples of operational outputs of the Productivity-Susceptibility risk analysis (PSA) for individual salmon farms from Los Lagos region at week 45 of 2014. (a) Biplot of the PSA where each dot is a production farm. The pop-up shows the normalised contribution of productivity (P1-P5) and susceptibility (S1-S6) attributes to the overall risk. [Attributes legend: P1 = fish density; P2 = fish weight at harvesting; P3 = fish weight at stocking; P4 = mortality by discard; P5 = mortality due to diseases; S1 = hydrodynamic connectivity with regards to other farms; S2 = average current speed; S3 = mortality due to predation (birds and sea lions); S4 = residence time of the sanitary neighbourhood; S5 = salinity; and S6 = temperature]. (b) The overall risk distribution for all salmon farms from Los Lagos region.
![Figure 10. Two examples of operational outputs of the Productivity-Susceptibility risk analysis (PSA) for individual salmon farms from Los Lagos region at week 45 of 2014. (a) Biplot of the PSA where each dot is a production farm. The pop-up shows the normalised contribution of productivity (P1-P5) and susceptibility (S1-S6) attributes to the overall risk. [Attributes legend: P1 = fish density; P2 = fish weight at harvesting; P3 = fish weight at stocking; P4 = mortality by discard; P5 = mortality due to diseases; S1 = hydrodynamic connectivity with regards to other farms; S2 = average current speed; S3 = mortality due to predation (birds and sea lions); S4 = residence time of the sanitary neighbourhood; S5 = salinity; and S6 = temperature]. (b) The overall risk distribution for all salmon farms from Los Lagos region.](/cms/asset/51b00366-a852-4665-a630-e1b25c088477/tjoo_a_1636606_f0010_oc.jpg)