Figures & data
Figure 1. Location of the subsurface mooring (white star). Colour shows the bathymetry of the western Pacific Ocean.
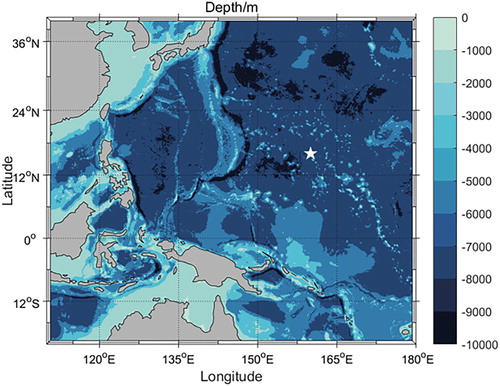
Table 1. Current meters in the subsurface mooring, deployed depths and operating frequencies of the current meters, data periods, number of days of observations, and depth range.
Figure 2. Daily averaged zonal (a, left) and meridional (b, left) velocities with mean values (red line) and standard deviations (blue curve) measured by the 300 k-Hz ADCP at 160°E, 15°N from June 2014 to May 2016.
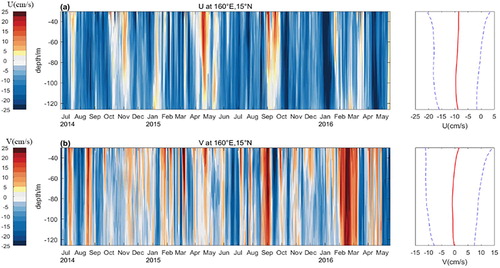
Figure 3. Daily averaged zonal (a, left) and meridional (b, left) velocities with mean values (red line) and standard deviations (blue curves) measured by the 75 k-Hz ADCP at 160°E, 15°N from June 2014 to September 2014.
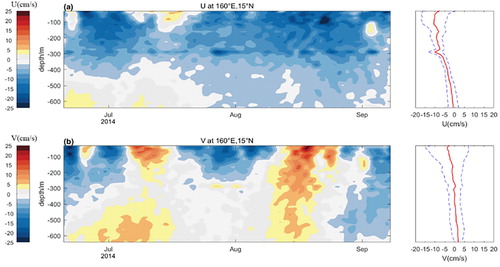
Figure 4. The zonal (blue line) and meridional (red line) velocities averaged from 30 m to 126 m depth (measured by the 300 k-Hz ADCP) and at depths of 860 and 1860 m (measured by the RCMs).
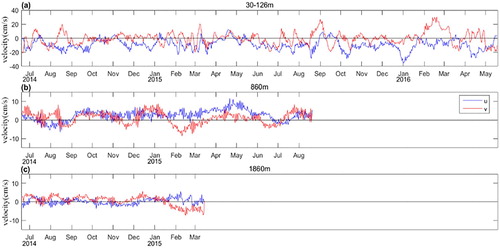
Figure 5. Power spectral density (PSD) of the zonal (a,c) and meridional (b,d) velocity time series at different depths including 30–126 m, 30–126 m depth-averaged, 860 and 1860 m.
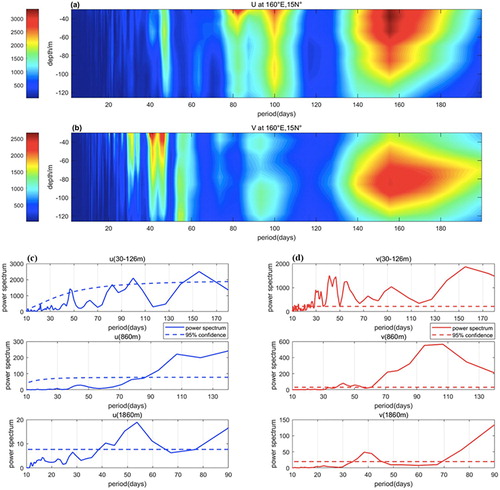
Figure 6. Time series of zonal and meridional velocities under a 20–120-day band-pass filter (a,b) and a 120-day low-pass filter (c,d) from 30 m to 126 m depth.
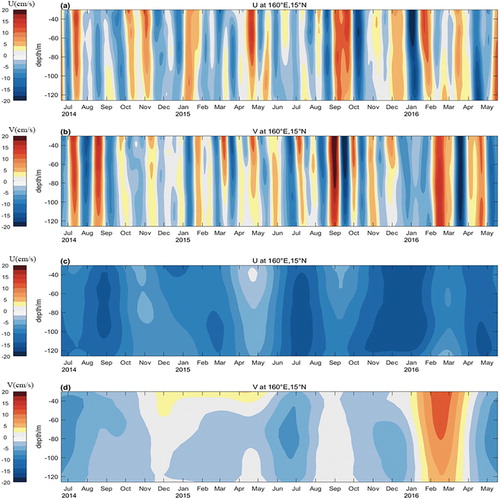
Figure 7. The zonal (a) and meridional (b) velocities averaged from depths of 30–126 m measured by mooring observations compared with the geostrophic currents from AVISO products.
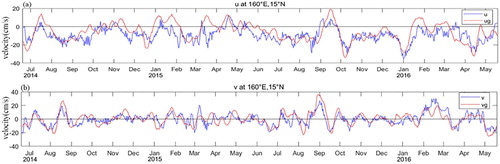
Figure 8. Correlation coefficient (above the 95% confidence level) between the velocities measured by mooring observations and the geostrophic currents from AVISO products.
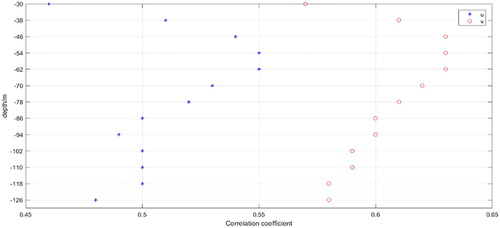
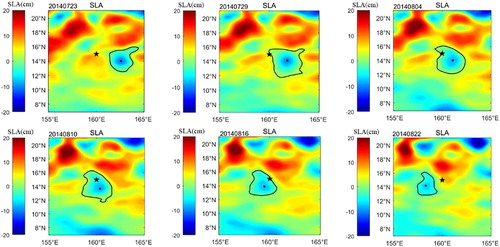
Figure 9. Process of CE1 transiting the mooring site. The black stars denote the mooring site. The black dots denote the centres of CE1, and the black lines denote the edges of CE1. CE2-5 are similar (not shown).