3,545
Views
31
CrossRef citations to date
0
Altmetric
Case Studies

Livelihood and migration patterns at different altitudes in the Central Highlands of Peru

&
Pages 69-76 | Received 29 Jan 2013, Accepted 06 Jul 2013, Published online: 09 Sep 2013

Figures & data

Figure 1. Location of the research site (map prepared by Milan & Rossow).

Figure 1. Location of the research site (map prepared by Milan & Rossow).

Figure 2. Total rainfall and number of rainy days per year from the Shullcas meteorological station. Rain years are calculated from July to the following June.
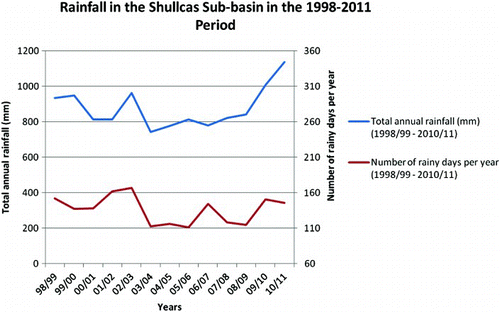
Source: Authors’ elaboration of SENAMHI data.
Figure 2. Total rainfall and number of rainy days per year from the Shullcas meteorological station. Rain years are calculated from July to the following June.

Figure 3. Average monthly rainfall of the 2009/10 and 2010/11 seasons versus long term average from the Shullcas meteorological station.
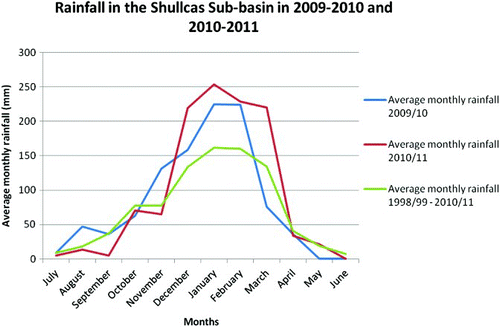
Source: Authors’ elaboration of SENAMHI data.
Figure 3. Average monthly rainfall of the 2009/10 and 2010/11 seasons versus long term average from the Shullcas meteorological station.
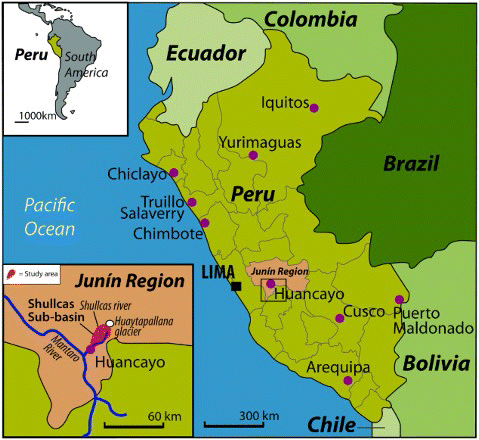
Table 1. Livelihood and mobility patterns by altitude – percentages refer to answers to the household survey.