Figures & data
Table 1. Major components and sub-components of CCVI developed for three villages of Laos.
Figure 1. Three-dimensional Climate Change Vulnerability Cube is a system of visualizing and plotting households within the cube in order to understand their level of vulnerability judged by their position. The cube is split into eight sub-cubes (i.e. A–G) to cluster households with similar characteristics. The goal is to move households towards a lower vulnerability position – see direction of arrow. Source: Adapted from Lin and Morefield (Citation2011).
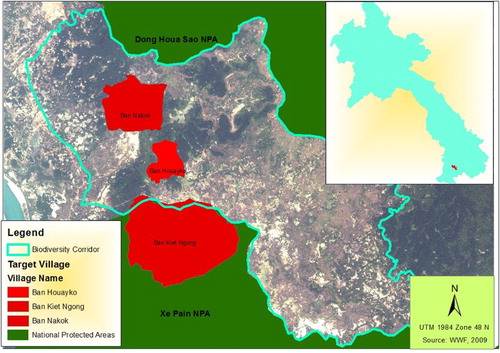
Figure 2. Study sites, Lao PDR.