Figures & data
Figure 1. Overall framework of research focus for Ethiopia, Kenya and the DRC.
Note: * RES = Renewable energy sources
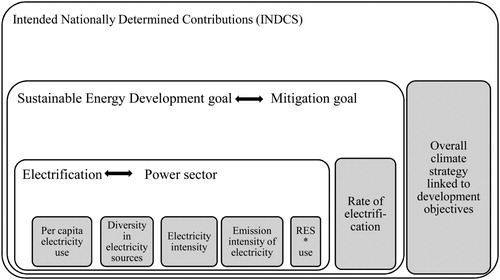
Table 1. Emissions mitigation targets, emission intensity in the economy and emissions per capita 1990–2030 – Ethiopia, Kenya and the DRC.
Table 2. Mitigation goals and development futures proposed by Ethiopia, Kenya and the DRC, selected parameters for comparison.
Figure 2 (a). Ethiopia – GDP and BAU scenario for emissions, and emissions reduction proposed in the INDC, 2005–2030. (b). Kenya – GDP and BAU scenario for emissions, and emissions reduction proposed in the INDC, 2005–2030. (c). DRC – GDP and BAU scenario for emissions, and emissions reduction proposed in the INDC, 2005–2030.
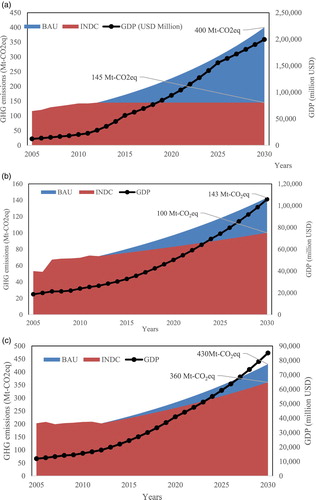
Table 3. The regression details of the Ethiopian, Kenyan and Congolese electricity generation.
Table 4. The investment costs of the planned power generation technologies (Miketa & Merven, Citation2012; Ndhlukula et al., Citation2015).
Table 5. The renewable potential and installed capacity of Ethiopia (Government of Ethiopia, Citation2011).
Figure 3. Electricity intensity and emission intensity of electricity of Ethiopia, as proposed from the INDCs.
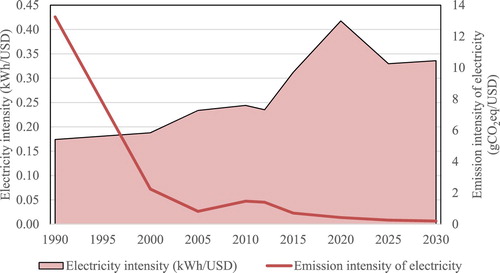
Table 6. The renewable potential and installed capacity of Kenya (International Institute for Sustainable Development, Citation2013; Kiplagat et al., Citation2011).
Figure 4. Electricity intensity and emission intensity of electricity of Kenya, as proposed from the INDCs.
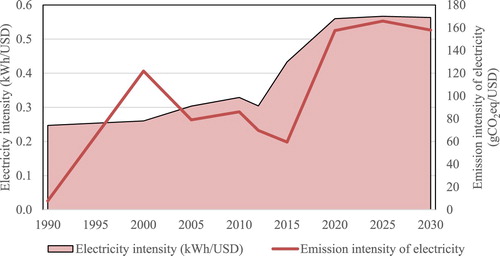
Figure 5. Electricity intensity and emission intensity of electricity of the DRC, as proposed from the INDCs.

Figure 6. Comparison of GHG emissions from the power sector of the three countries, as per the INDCs.
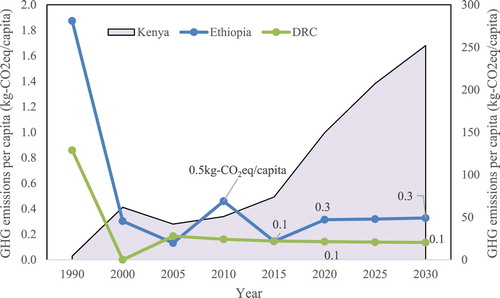
Table 7. Share of renewables and installed capacity per capita in the three countries, with 2030 values being projected amounts if the INDCs and plans are realized.
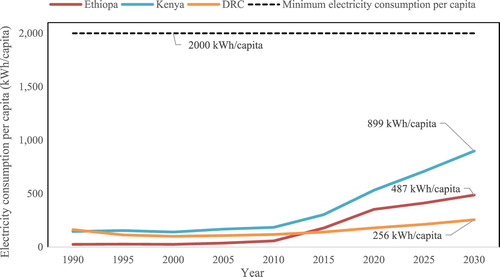
Figure 7. Electricity consumption per capita in Ethiopia, Kenya and DRC up to the year 2030.