Figures & data
Figure 1. Map of the study area (base map from Google Earth; imagery from Google, Maxar Technologies, CNES/Airbus).
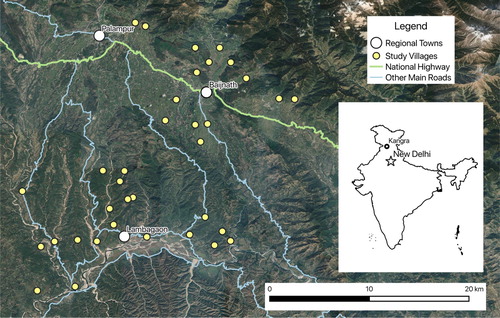
Figure 2. Precipitation trends, (A) pre-monsoon and (B) monsoon months (source NASA TRMM_3B43 dataset, Citation2011).
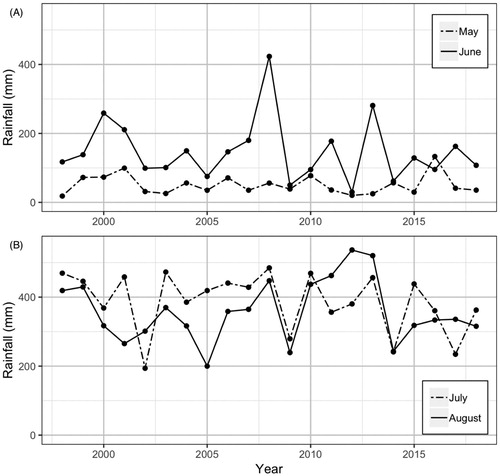
Figure 3. Count of main project types in the dataset.
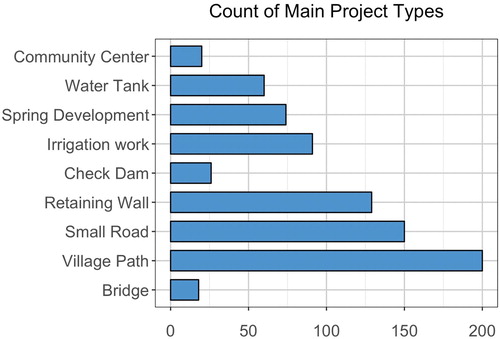
Figure 4. 79% of water projects report improving water availability for drinking, domestic use, irrigation, or livestock.
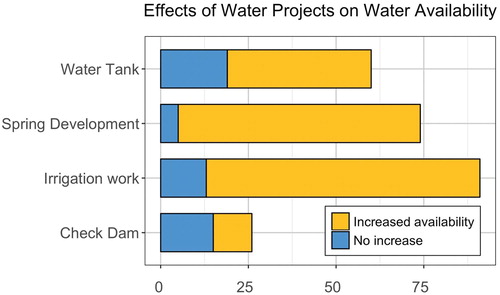
Figure 5. The canal was desilted and widened to improve water flow.
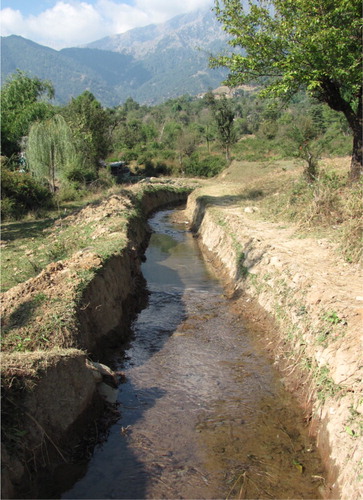
Figure 6. The upper layer of the retaining wall was repaired following damage of a storm, helping to ensure continued water availability downstream.
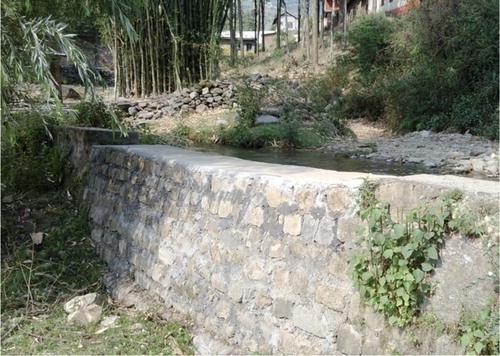
Figure 7. (A) Total labour days for men and women, (B) median labour days (for those who had received labour), and (C) the proportion of households who have received labour from each gender in the primary data.
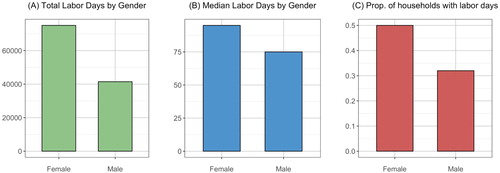
Figure 8. (A) Proportion of households who have received labour and (B) Median labour days of those who have received labour from different social groups (2010–2012).
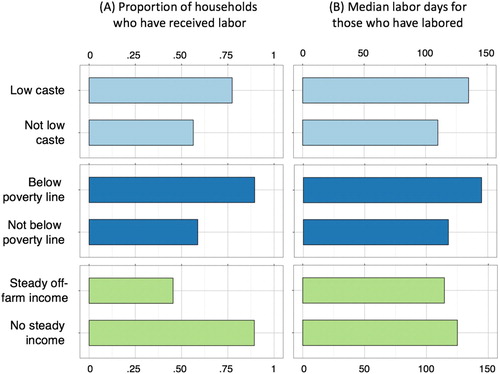
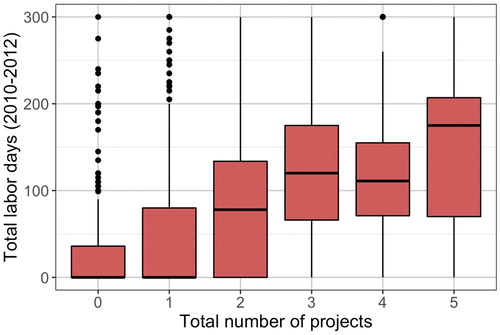
Figure 9. Boxplot of the relationships between total labour days and number of projects that a household has benefitted from.