
Figures & data
Table 1. Climate change perceptions of rice producers in Chitwan District in the past 10 years (2009–2018).
Table 2. Comparison of institutional factors – Extension, training and information (adapted from Singh, Citation1997).
Table 3. Durbin–Wu–Hausman test of endogeneity for variety, irrigation and DSR.
Figure 1. Study area of three villages in Chitwan district, which is located in the south-central Plains (Terai) region of Nepal.
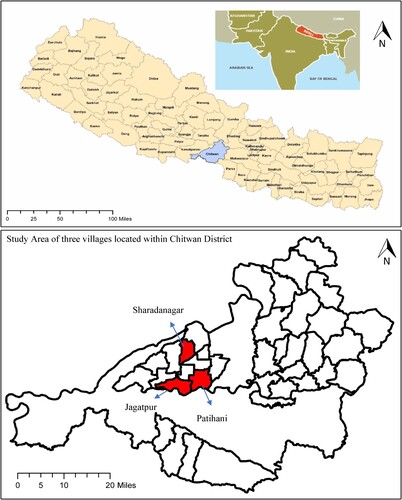
Table 4. Descriptions of variables used in the multivariate probit model.
Figure 2. Conceptual model of triangulation and complementarity between climate change adaptations and institutional factors.
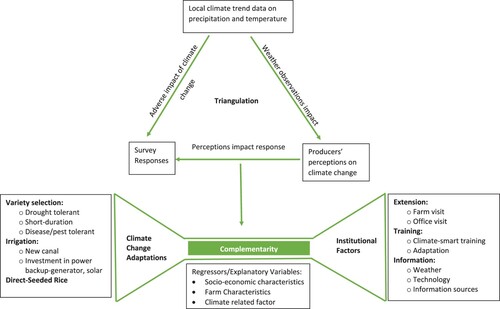
Figure 3. Average annual temperature trend of Nepal (1987–2016). Source: World Bank Group (Citation2020).
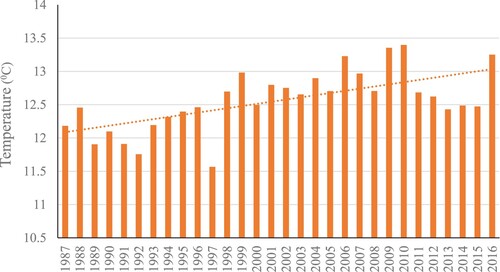
Figure 4. Average annual precipitation trend of Nepal (1987–2016). Source: World Bank Group (Citation2020).
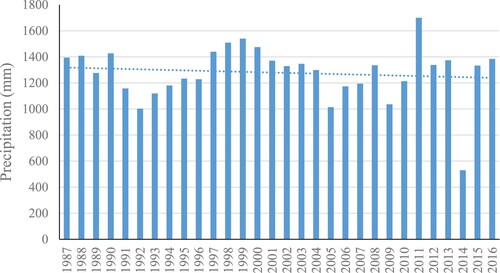
Figure 5. Average annual temperature at Rampur, Chitwan (2009–2018). Source: Department of Hydrology and Meteorology, Citation2019, Kathmandu, Nepal.
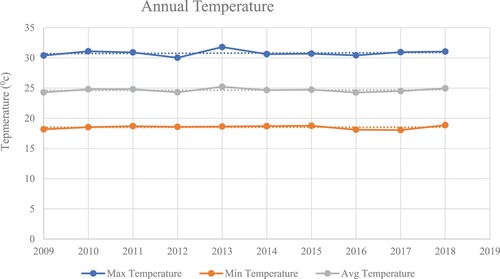
Figure 6. Maximum, minimum and average seasonal temperature (June–October) at Rampur, Chitwan (2009–2018). Source: Department of Hydrology and Meteorology, Citation2019, Kathmandu, Nepal.
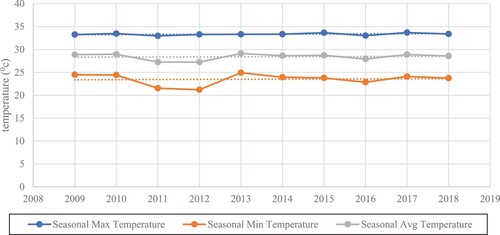
Figure 7. Annual and seasonal rainfall (June–October) at Rampur, Chitwan (2009–2018). Source: Department of Hydrology and Meteorology, Citation2019, Kathmandu, Nepal.
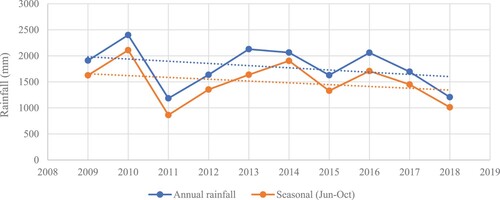
Table 5. Empirical results of the multivariate probit model.
Table 6. Predicted likelihood of adoption of multiple climate change adaptation practices by hypothetically increasing institutional factors and pairwise correlation coefficients between the predicted likelihood.
Table A1. Correlation matrix of institutional factors.
Table A2. Variation inflation factors for variables.
Table A3. Conditional index values for variables.
Table A4. Extension: instrument is ethnicity.
Table A5. Training: Instrument is risk-averse producers.
Table A6. Information: instrument is the literacy rate in the family.