Figures & data
Table 1. Summary statistics of key variables used in the regressions.
Figure 1. Proportion of vulnerable and resilient rural households between 2012 and 2019 in Zambia. Notes: Own calculations from RALS (2012-2019).

Figure 2. Poverty transitions among rural households over three surveys: 2012, 2015, 2019. Notes: Own calculations from RALS (2012-2019). PPP and NNN signal poor and not poor in all three waves, respectively, whereas alternating P and N letters signals whether a household was poor (P) or not poor (N) in a given survey year. For example, PPN means poor in 2012 and 2015 but not in 2019.
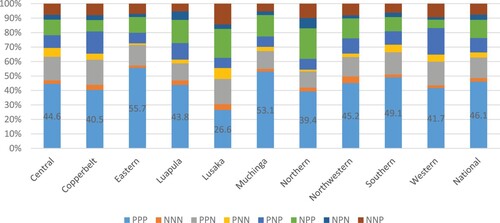
Figure 3. Proportion of chronic, transient, and never poor rural households between 2012 and 2019 in Zambia. Notes: Own calculations from RALS (2012-2019).
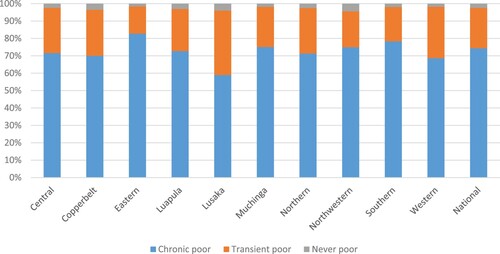
Table 2. First stage results on the relevance of instrumental variables.
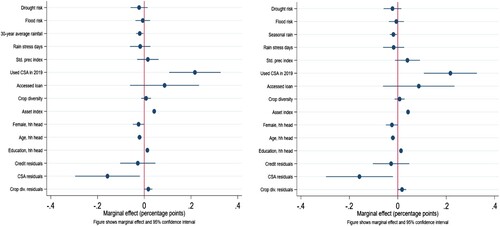
Figure 4. Selected effects of climate exposure on vulnerability among smallholders in Zambia with 30-year average rainfall (left panel) and seasonal rainfall (right panel). Notes: A confidence interval for a point estimate that lies on either side of the zero shows that the estimate is statistically significant.
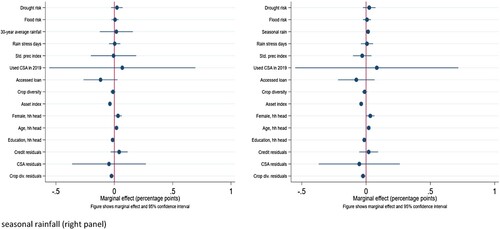
Figure 5. Selected effects of climate exposure on resilience among smallholders in Zambia with 30-year average rainfall (left panel) and seasonal rainfall (right panel). Notes: A confidence interval for a point estimate that lies on either side of the zero shows that the estimate is statistically significant.