
Figures & data
Table 1. Number of publications per year in the final analysis focused on cultural heritage and climate change from 2016 to 2020
Table 2. The publication sources ranked by number of publications on cultural heritage and climate change. All sources with three or more publications present in the database are included. Asterisks indicate those known to have published Special Issues on relevant topics
Table 3. Number of publications classified by their primary discipline (as derived from the Web of Science categorisations for each source)
Table 4. Grouped average number of citations per year for the set of publications
Figure 1. Shannon diversity indices for institutional diversity and regional diversity. These demonstrates that collaboration between different institutions within a single region is far more common than international collaboration
Figure 2. Number of instances of authorship for publications on cultural heritage and climate change from 2016–2020, colour-coded by continent. darker links = intercontinental. Nomenclature: Country name, Total publications (Number of publications with international collaboration, r = number of regions)
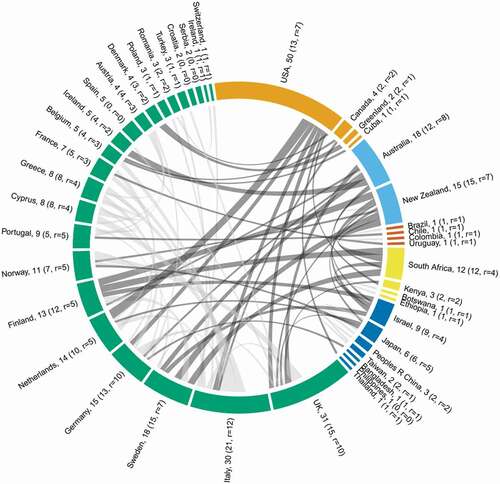
Figure 3. The region of focus of reviewed publications grouped by continent (n > 3). Note, some publications had multiple regions (n = 12) and publications that were unsituated (n = 19) or had a global, continental, or oceanic focus (n = 20) were not included
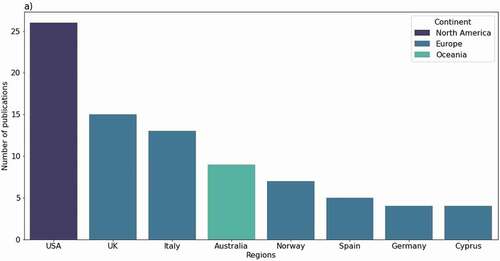
Table 5. The region of focus for all reviewed publications, grouped by continent. Note, some publications had multiple regions (n = 12) and publications that were unsituated (n = 19) or had a global, continental, or oceanic focus (n = 20) were not included
Table 6. The number of publications considering different types of heritage: percentages are shown relative to the total number of publications (n = 165). The main foci are not mutually exclusive
Figure 4. Chord diagram representing instances of research methods used in 165 publications on cultural heritage and climate change published from 2016–2020. The thickness of links indicates the relative proportion of ‘co-instance’ of these methods being used. Note that instances are not mutually exclusive: thus, publications that employed three or more research methods (n = 9) will produce several instances
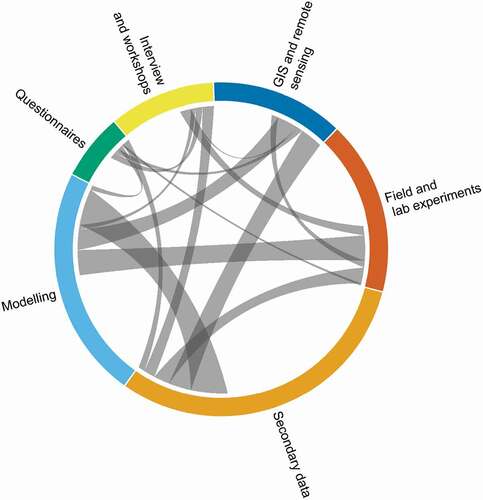
Table 7. Benefits of research on cultural heritage and climate change identified in the review
Table 8. Barriers and challenges to research on cultural heritage and climate change identified in the review