
Figures & data
Figure 1 Flow of wool through New Zealand’s strong wool value chain (Adapted from Conforte, Dunlop, and Garnevska Citation2011).
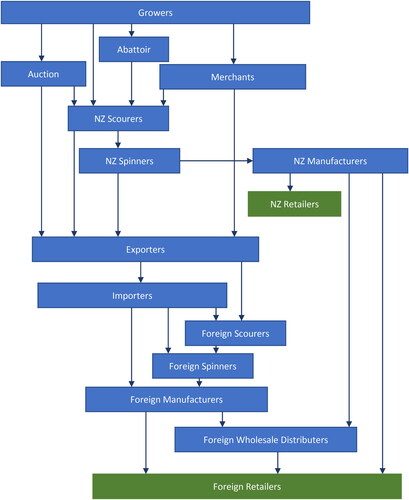
Table 1. Participant information.
Figure 2 Manufacturers’ reliance at various parts of the supply chain.
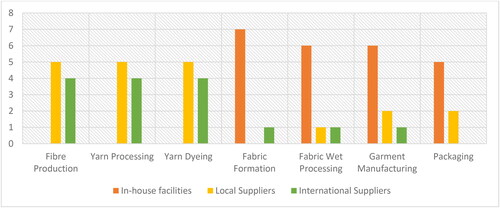
Figure 3 Impact on the supply chain.
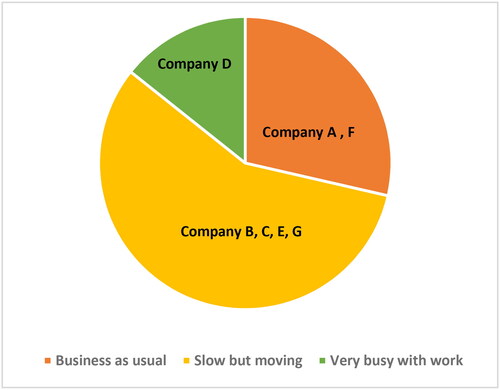
Table 2. Selected quotes from survey participants on the impact of border restrictions.
Figure 4 Impact on domestic sales.
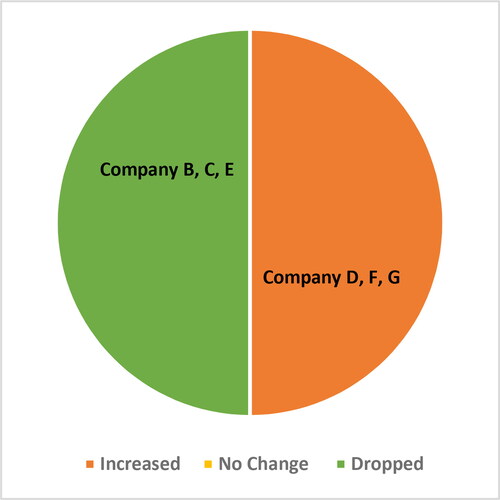
Figure 5 Impact on international sales.
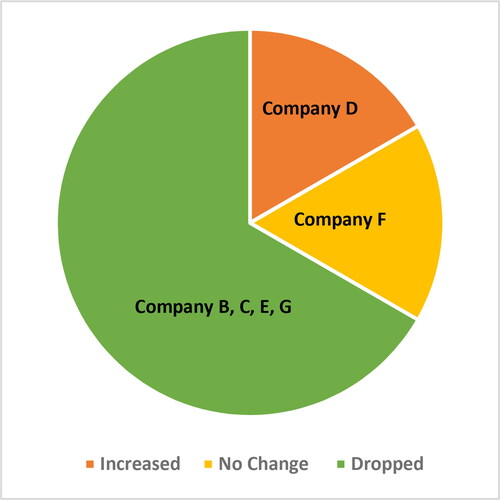
Figure 6 Future business plans.
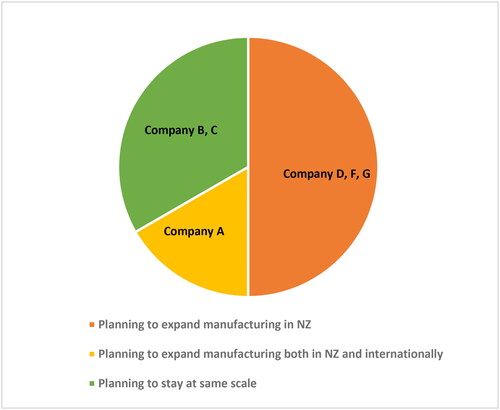
Figure 7 Review of government support.
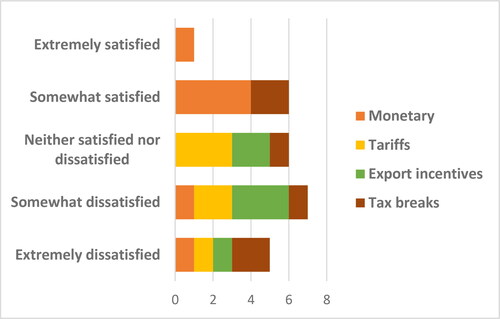
Table 3. Some direct quotes from participants on additional help sought from the government.
Table 4. SWOT analysis of New Zealand’s knitwear manufacturing sector.