Figures & data
Figure 1. Diagram of CB307 format and structure. CB307 is made up of 3 Humabody® VH units connected with flexible peptide linkers that targets PSMA (HGNC: FOLH1), CD137 (HGNC:TNFRSF9 - also known as 4-1BB) HSA.
HSA: Human serum albumin; PSMA: Prostate-specific membrane antigen.
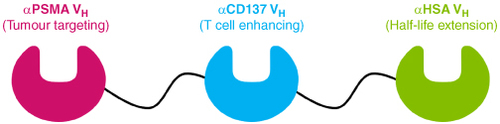
Figure 2. Assay format for the determination of CB307 in human serum on the Gyrolab. (1) Biotinylated Anti-αPSMA VH Anti-id binds to streptavidin beads within the 15 nl affinity column of the Gyrolab CD. Following a wash step (2) samples containing CB307 pass through the column. Any CB307 present binds to the immobilised Anti-40C5 anti-idiotype. (3) Detection antibody AlexaFluor647 conjugated Anti-αCD137 VH Anti-id binds to CB307. A laser within the Gyrolab instrument induces fluorescence from the AlexaFluor at 647 nm which is measured and is relative to the amount of CB307 present in the sample. Figure generated using BioRender.com.
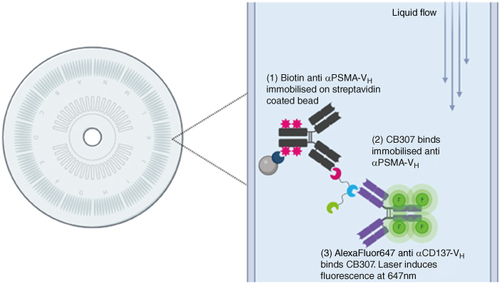
Figure 3. Selectivity at LLOQ using ten- and 20-fold MRDs.10 healthy human serum individuals were spiked with CB307 at the assay LLOQ of 30.0 ng/ml (tenfold MRD) or 60.0 ng/ml (20-fold MRD) and back-calculated recovery was compared against the theoretical concentration.
Ind: Individual; LLOQ: Lower limit of quantification; MRD: Minimum required dilution.
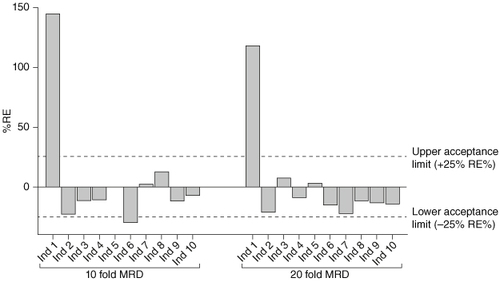
Figure 4. Comparison of original and reverse antibody orientations. (A) S/N of CB307 at LLOQ of 60.0 ng/ml using a tenfold and 20-fold MRD with original antibody orientation (Capture: Biotin anti-αCD137 VH Anti-id, Detection: AlexaFluor647 anti-αPSMA VH anti-id) and reverse antibody orientation (Capture: biotin anti-αPSMA VH anti-id, Detection: AlexaFluor647 anti-αCD137 VH anti-id). (B) Calibration curve of CB307 (between 60.0 and 4000 ng/ml) with a 20-fold MRD using the original and reverse antibody orientation.
S/N: Signal/noise; MRD: Minimum required dilution.
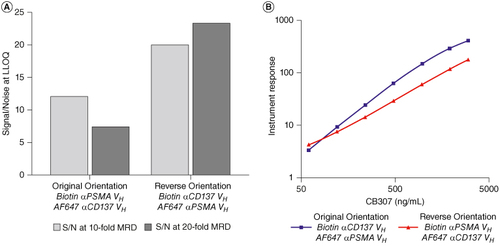
Figure 5. Selectivity in individuals showing matrix effects in previous experiments using the original and new antibody orientation. CB307 added into four individuals at 60.0 ng/ml using a 20-fold MRD and back-calculated recovery was compared against the theoretical concentration.
DS: Disease State; Ind: Individual; MRD: Minimum required dilution; RE: Relative error.
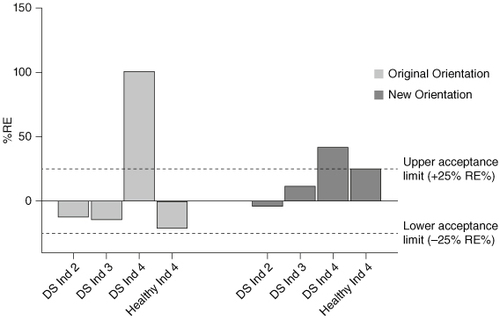
Figure 6. A column profile showing fluorescent intensity within the 15 nl affinity column of the Bioaffy 1000 CD and Bioaffy 1000 HC CD. The profile shows fluorescent intensity, radius of the affinity column and angle of the affinity column on the y-axis, z-axis and x-axis, respectively. High fluorescent intensity is detailed by a red peak, whereas low fluorescent intensity is detailed by a blue peak. The white box is known as the Integration Area and is where the instrument measures the fluorescence. (A) Column profile on the 1000 CD for CB307 determination; a broad, poorly defined peak extending outside the integration area is shown. (B) Column profile on the 1000 HC CD for CB307 determination; a sharp, well-defined peak contained within the integration area is shown.
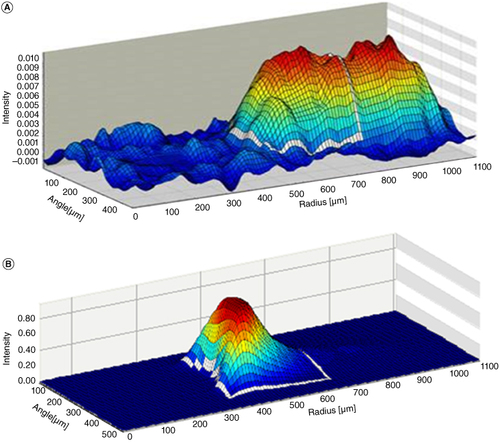
Table 1. CB307 binding kinetics to anti-αCD137 VH anti-id and anti-αPSMA VH anti-id (anti-idiotype) Abs.
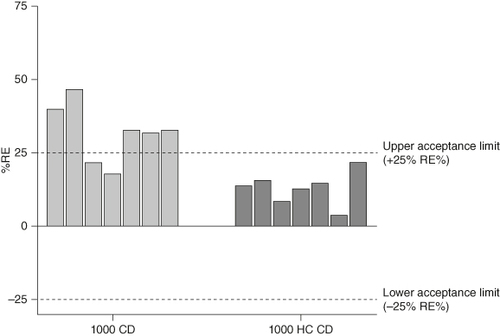
Figure 7. Comparison of selectivity results in healthy individuals at assay LLOQ using the Bioaffy 1000 CD and Bioaffy 1000 HC CD. Seven healthy individuals were spiked at the LLOQ of 100 ng/ml, with an 80-fold MRD applied and analyzed on the Bioaffy 1000 and Bioaffy 1000 HC CD. Back-calculated recovery was compared against the theoretical concentration.
LLOQ: Lower limit of quantification; MRD: Minimum required dilution; RE: Relative error.