915
Views
0
CrossRef citations to date
0
Altmetric
Review

A review of prospective studies regarding percutaneous peripheral nerve stimulation treatment in the management of chronic pain

ORCID Icon, ORCID Icon, ORCID Icon, , ORCID Icon, ORCID Icon, ORCID Icon & ORCID Icon show all
Pages 209-222 | Received 26 Feb 2024, Accepted 03 May 2024, Published online: 10 Jun 2024

Figures & data

Figure 1. Flow chart for literature search. Publications that met the inclusion criteria are summarized by the publication count in parentheses and the number of unique study cohorts.
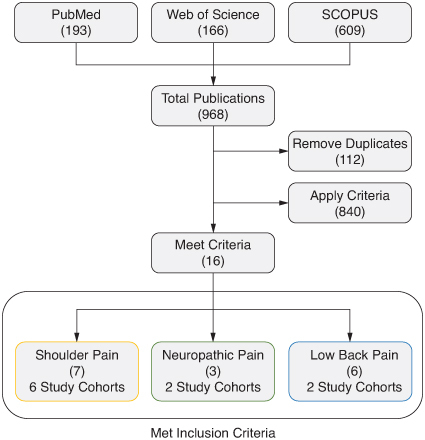
Figure 1. Flow chart for literature search. Publications that met the inclusion criteria are summarized by the publication count in parentheses and the number of unique study cohorts.

Table 1. Review and synthesis of publications of prospective studies of percutaneous PNS treatment to manage chronic pain.

Figure 2. Study outcomes timeline. Percutaneous PNS treatment period ranged from 14 to 60 days (green boxes). Reported outcome timepoints (triangles) were grouped as end-of-treatment, 3–5-month follow-up, 6–8-month follow-up and 12–14-month follow-up (months from therapy onset, orange boxes). Study cohort definitions and data sources are presented in .

EOT: End-of-treatment; PNS: Peripheral nerve stimulation.
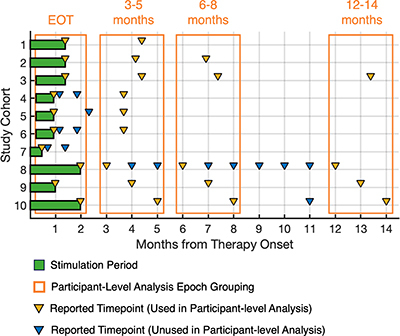
Figure 2. Study outcomes timeline. Percutaneous PNS treatment period ranged from 14 to 60 days (green boxes). Reported outcome timepoints (triangles) were grouped as end-of-treatment, 3–5-month follow-up, 6–8-month follow-up and 12–14-month follow-up (months from therapy onset, orange boxes). Study cohort definitions and data sources are presented in Table 1.EOT: End-of-treatment; PNS: Peripheral nerve stimulation.

Figure 3. Summary data and composite responder analysis. (A) Mean pain intensity by study cohort. (B) Mean average pain interference scores by study cohort. Overall mean pain intensity and pain interference scores presented as dashed black lines in (A & B). Participant-level data presented as individual outcomes (points) and mean ± standard error (lines and error bars). (C) Summary of composite responder rate for each timepoint. Composite responder defined as a participant who experienced highly clinically meaningful reduction (≥50%) in pain intensity and/or pain interference. Responder rates presented as a percentage of total study participants with data available at each time point. (D) Composite responder rate for each study cohort at EOT, with the overall summary of responder rate at EOT (73%) represented by the black dotted line. Data presented as mean ± 95% confidence interval (bars and error bars). (E) Color legend for study cohorts. Data sources are presented in .

Avg: Average; BPI: Brief pain inventory; EOT: End-of-treatment; mo: Month; NA: Not applicable.
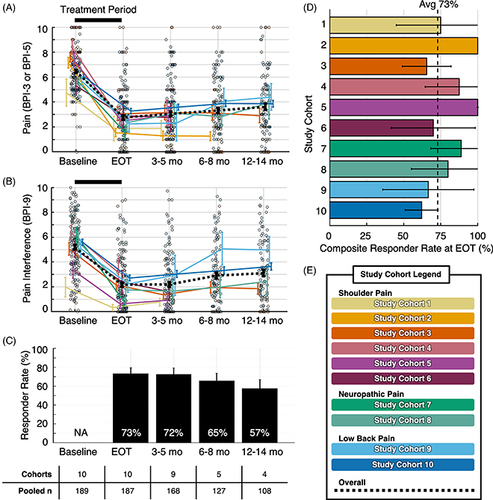
Figure 3. Summary data and composite responder analysis. (A) Mean pain intensity by study cohort. (B) Mean average pain interference scores by study cohort. Overall mean pain intensity and pain interference scores presented as dashed black lines in (A & B). Participant-level data presented as individual outcomes (points) and mean ± standard error (lines and error bars). (C) Summary of composite responder rate for each timepoint. Composite responder defined as a participant who experienced highly clinically meaningful reduction (≥50%) in pain intensity and/or pain interference. Responder rates presented as a percentage of total study participants with data available at each time point. (D) Composite responder rate for each study cohort at EOT, with the overall summary of responder rate at EOT (73%) represented by the black dotted line. Data presented as mean ± 95% confidence interval (bars and error bars). (E) Color legend for study cohorts. Data sources are presented in Table 1.Avg: Average; BPI: Brief pain inventory; EOT: End-of-treatment; mo: Month; NA: Not applicable.
Supplemental material

Supplementary Materials

Download MS Word (60.3 KB)