Figures & data
Table 1. Emission factors associated with use and producing service in each infrastructure sector.
Table 2. Data source of infrastructure use, local production and the energy efficiency associated with local production, separated by sector in four cities.
Table 3. Demographic and community-wide energy and material use organized by different infrastructure sectors (industrial, commercial, and household), when breakdown is possible.
Figure 1. Pie charts of total CIFGHG for Chinese cities of different size. The trans-boundary contributions are shown as hatched areas for each infrastructure sector. For some sectors, such as water supply/wastewater treatment, their contribution to total CIF is less than 1%, and the labels for these sectors are not shown in the pie chart. WTP: wells-to-pump; WS/WWT: water supply and wastewater treatment; MSW: municipal solid waste.
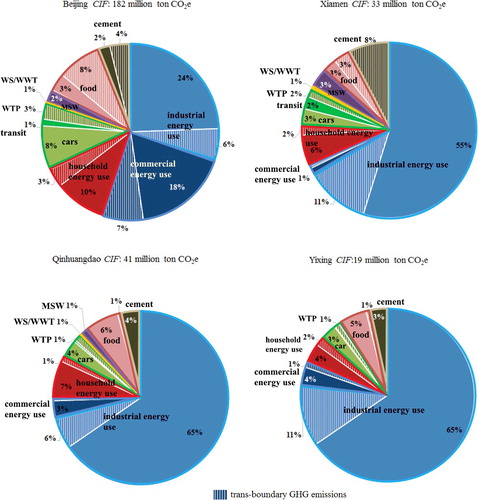
Figure 2. The proportion of GHG emissions from energy end use in four Chinese cities. The coal and related products’ end use is energy used in non-power plant sectors. All cities produce and import electricity for use, as shown in light blue. IB: in-boundary; TB: trans-boundary.
Figure 3. Benchmarks: metrics of material/energy use efficiency of infrastructure sectors in four Chinese cities. GDP: gross domestic product; QHD: Qinhuangdao.