
Figures & data
Figure 1. The location and image of the study site.
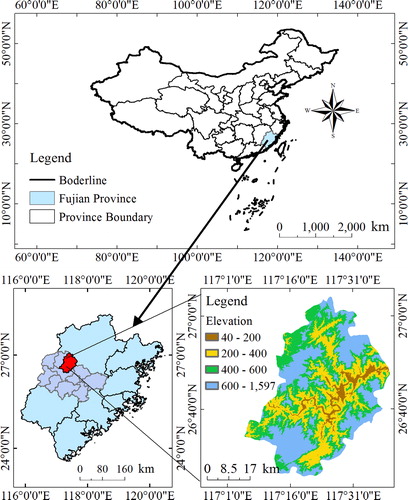
Table 2. Biomass (Mg·ha−1) and its allocation in different elevation classes at forest edges and forest interior.
Figure 2. Regression relationship of basal area (BA) with total tree biomass (TTB) and total tree carbon (TTC) at forest edge (a) and forest interior (b). Regression model (a) R2 = 0.09980 with standard error of estimate 9.3966 and regression model (b) R2 = 0.9985 with standard error of estimate 8.7943.
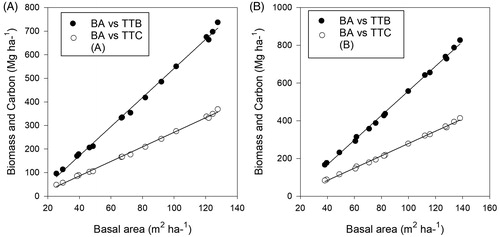
Table 3. Carbon density (Mg·ha−1) and its allocations in different elevation classes at forest edges and forest interior.
Figure 3. (a) Carbon density (Mg·ha−1) in different elevation classes (different letters on the bars indicate significant differences in carbon density among the elevation classes); (b) percentage contribution of carbon pools in different components at forest edges and forest interior. AGC, aboveground carbon; BGC, belowground carbon; SH, shrub; HER, herb; DW, detritus; SOC, soil organic carbon
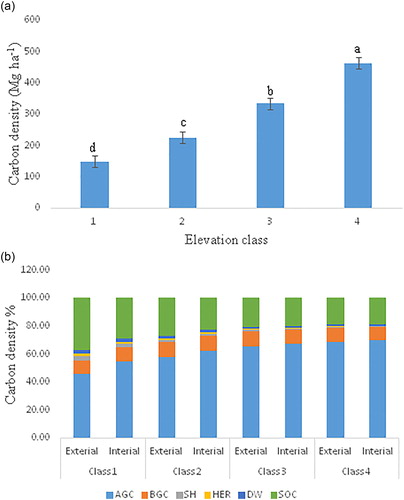
Figure 4. (a) Soil carbon concentration (Mg·ha−1) of different depths at forest edge and forest interior among different elevation classes; (b) soil carbon concentration (Mg·ha−1) at different depths among different elevation classes.
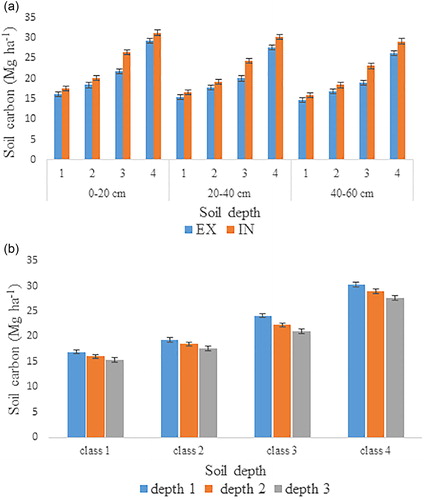
Table 1. Characteristics of the Cunninghamia lanceolata at Forest exterior (EX) and Forest interior (IN) in Jiangle County, Fujian Province.