Figures & data
Table 1. Physical and chemical characteristics of the five organic amendments.
Figure 1 Evolution of soil pH on day 0 and on day 112 for the control (S) and amended soils: green waste (GW), ovine manure (OM), compost of olive husk (CM), palm compost (CP) and olive mill wastewater (OWM); lower-case letters indicate significant differences between treatments on day 0 and upper-case letters indicate significant differences between treatments on day 112.
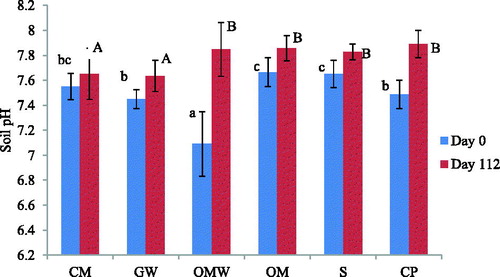
Figure 2 Evolution of electrical conductivity on day 0 and on day 112 for the control (S) and amended soils: green waste (GW), ovine manure (OM), compost of olive husk (CM), palm compost (CP) and olive mill wastewater (OWM).
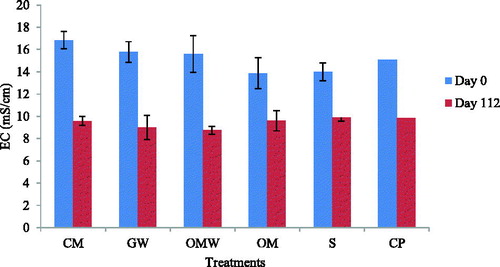
Figure 3 Ammonium and nitrate content for the control (S) and amended soils: green waste (GW), ovine manure (OM), compost of olive husk (CM), palm compost (CP) and olive mill wastewater (OWM): (a) ammonium content during the experiment; (b) ammonium content during the first week; (c) nitrate content during the experiment; (d) nitrate during the first week.
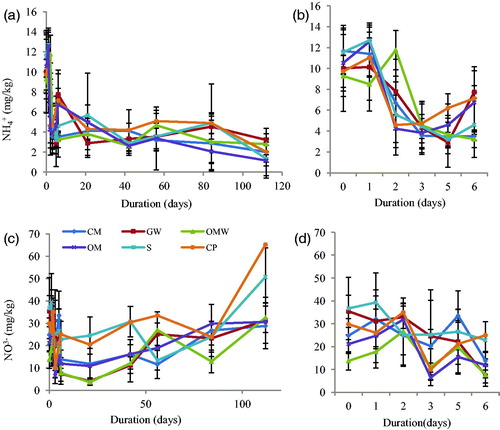
Figure 4 Total nitrogen content on day 0 and on day 112 for the control (S) and the amended soils: green waste (GW), ovine manure (OM), compost of olive husk (CM), palm compost (CP) and olive mill wastewater (OWM). Upper-case letters indicate significant differences between treatments on day 0 and lower-case letters indicate significant differences between treatments on day 112.
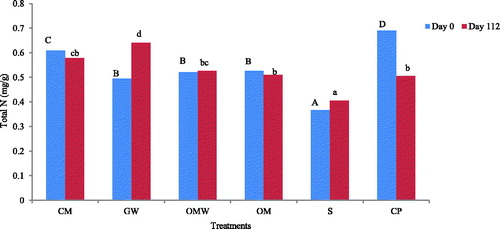
Figure 5 Organic matter content on day 0 and on day 112 for the control (S) and the amended soils: green waste (GW), ovine manure (OM), compost of olive husk (CM), palm compost (CP) and olive mill wastewater (OWM); lower-case letters indicate significant differences between treatments on day 0 and upper-case letters indicate significant differences between treatments on day 112.
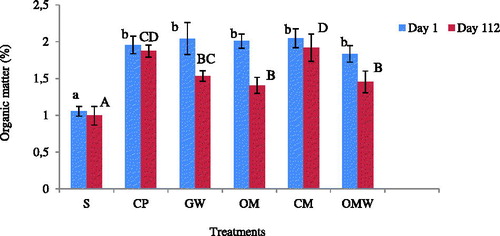
Figure 6 Net C mineralization for each treatment: green waste (GW), ovine manure (OM), compost of olive husk (CM), palm compost (CP) and olive mill waste water (OWM) during the experiment. (a) daily respiration during the first week; (b) daily respiration during the experimentation; (c) cumulative respiration.
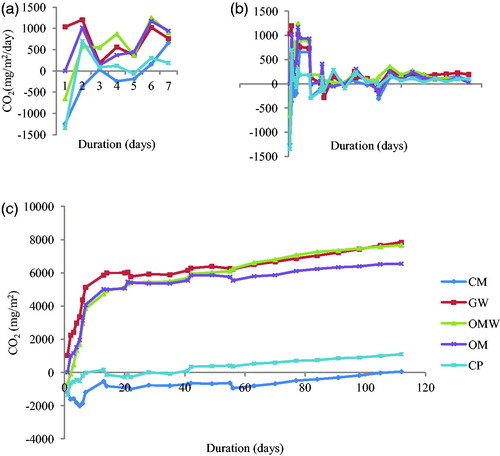
Table 2. Evolution of SOC for all the treatments, and evaluation of SOC gain and SOC balance.
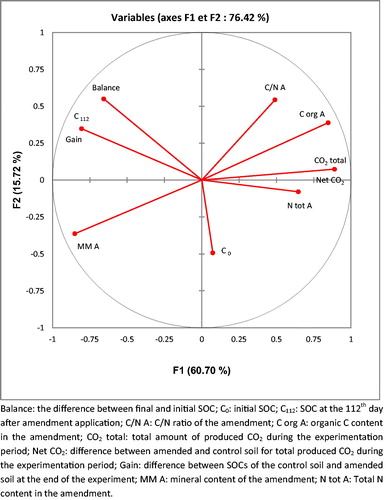
Figure 7 Projection of the different studied variables on the factorial plan. Factors 1 and 2 explained 76.42% of total observed variability.