
Figures & data
Table 1. Overview of specific Tier 2 requirements for GHG calculations in cropland within mitigation projects and approach in SECTOR.
Figure 1. (a) Schematic overview of spatial aggregation from patches to domain; (b) possible patch-domain pairs at different scales.
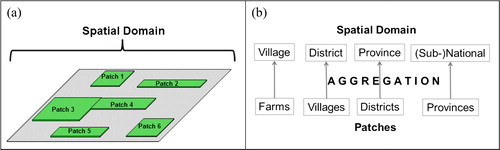
Figure 2. (a) Schematic overview of patches, seasons and scenarios; (b) triangulation of GHG data points.
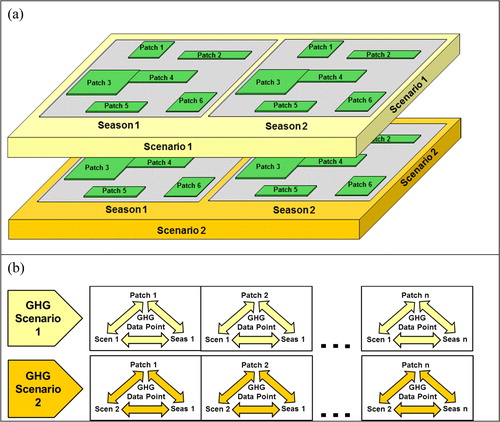
Table 2. Example for frequency (percentage) survey data for different SFw values and frequency-weighted SFw value for entire GHG data point (patch/season/scenario).
Figure 3. Flowchart of operations in SECTOR.
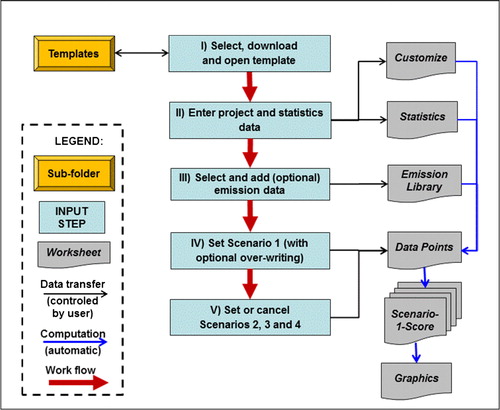
Figure 4. Operations in the ‘Data Points’ worksheet for an example with two seasons and two scenarios: (a) scenario-wide and data-specific entries (over-writing); and (b) setting and cancelling of scenarios.
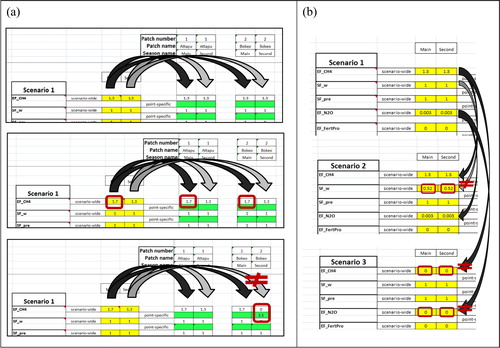
Table 3. Activity data and emission factors in spring (Spr) and summer (Sum) rice seasons in Thai Binh province; emission factors for CH4 (EF_CH4) and N2O (EF_N2O) comprise IPCC default values for continuous flooding (CF) and empirical data (shaded in gray) for the Red River Delta from Tariq et al. [Citation24] for CF, single aeration (1xAe) and double aeration (2xAe).
Figure 5. GHG emissions in Thai Binh Province from rice in the spring season calculated using different emission factors, namely the IPCC default value and empirical data from Tariq et al. [Citation24] for continuous flooding (CF), single aeration (1xAe) and double aeration (2xAe).
![Figure 5. GHG emissions in Thai Binh Province from rice in the spring season calculated using different emission factors, namely the IPCC default value and empirical data from Tariq et al. [Citation24] for continuous flooding (CF), single aeration (1xAe) and double aeration (2xAe).](/cms/asset/c63d5838-4d69-461e-8ef7-6b51a0790f4c/tcmt_a_1553436_f0005_c.jpg)
Figure 6. GHG emissions in Thai Binh Province from rice in the summer season calculated using different emission factors, namely the IPCC default value and empirical data from Tariq et al. [Citation24] for continuous flooding (CF), single aeration (1xAe) and double aeration (2xAe).
![Figure 6. GHG emissions in Thai Binh Province from rice in the summer season calculated using different emission factors, namely the IPCC default value and empirical data from Tariq et al. [Citation24] for continuous flooding (CF), single aeration (1xAe) and double aeration (2xAe).](/cms/asset/8bd5ae8d-4e38-45eb-97de-06ee5c532322/tcmt_a_1553436_f0006_c.jpg)