
Figures & data
Figure 1. Dynamic model. GDP: Gross domestic product.
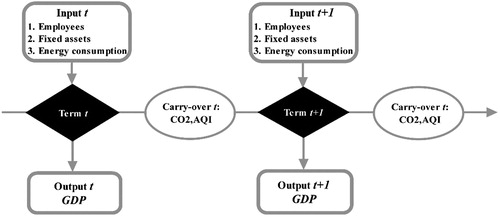
Table 1. Input and output items.
Figure 2. Input and output variables by year. GDP: Gross domestic product.
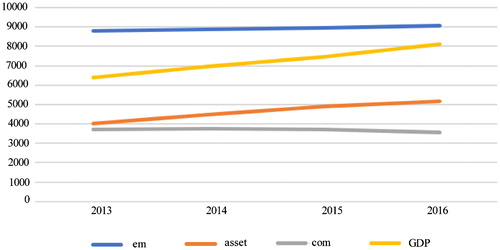
Table 2. City efficiency scores and rankings from 2013 to 2016.
Figure 3. CO2, Air Quality Index (AQI) and Gross Domestic Product (GDP) efficiency scores in 2013.
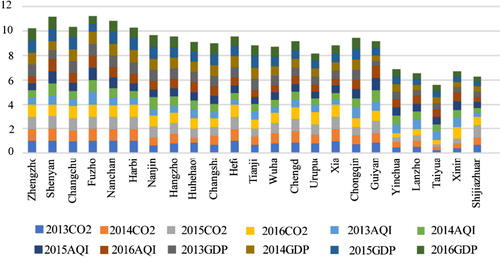
Table 3. Environmental energy, CO2 and air quality index (AQI) efficiency scores and rankingss by city.
Figure 4. Air Quality Index (AQI) efficiency scores from 2013 to 2016.
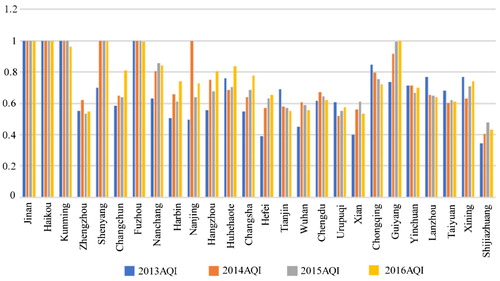
Figure 5. CO2 efficiency scores from 2013 to 2016.
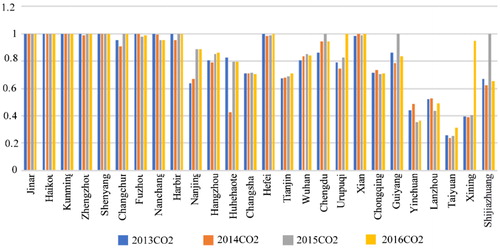
Figure 6. Environmental energy efficiency (com) by city from 2013 to 2016.
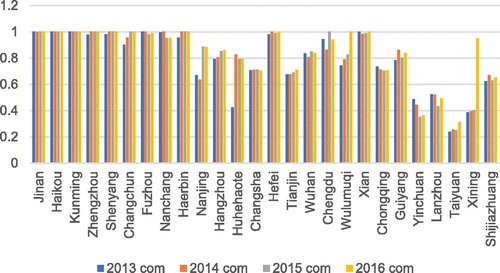
Figure 7. Gross domestic product (GDP) efficiency scores by city from 2013 to 2016.
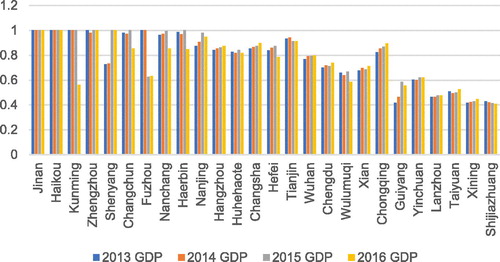
Table 4. Percentage improvements needed from 2013 to 2016.
Figure 8. The Cities' data average of input variable by eastern and western region. Input variables include Fixed assets (asset), Energy consumption (com), Gross Domestic Product (GDP), Carbon Dioxide (CO2), Air Quality Index (AQI)
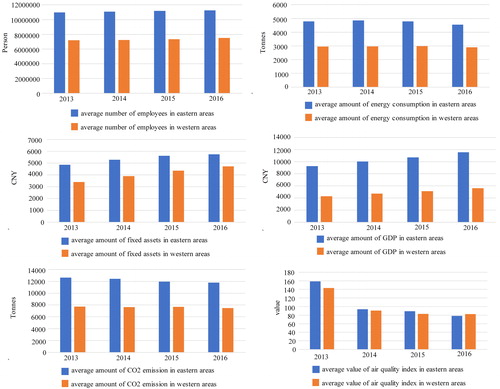
Table 5. The cities’ data average of input variables by region (east vs. west).
Table 6. The cities’ data average of output variables by region (east vs. west).
Table 7. Efficiency, overall and by year, compared between eastern and western regions.
Table 8. Energy, CO2 and air quality index (AQI) efficiency each year between eastern and western regions.
Table 9. Cities with and without CO2 and air quality index (AQI) efficiency scores, and ranking comparisons.