Figures & data
Table 1. Some literature on carbon dioxide emissions forecasting over the last decade.
Table 2. Summary of the literature on the influencing factors of carbon emissions.
Table 4. MAPE prediction results with the LSTM and the BP.
Table 5. Unit root test for stationarity.
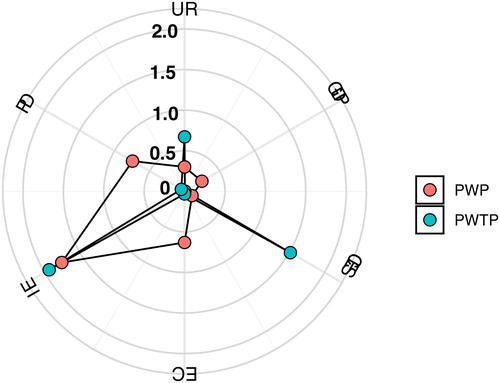
Table 6. Estimated results for the PWP and PWTP.
Table 7. Empirical results for the provinces without a CO2 emission peak value (dynamic).
Fang D, Zhang X, Yu Q, et al. A novel method for carbon dioxide emission forecasting based on improved Gaussian processes regression. J Cleaner Prod. 2018; 173:143–150. Pao HT, Fu HC, Tseng CL. Forecasting of CO2 emissions, energy consumption and economic growth in China using an improved grey model. Energy. 2012; 40(1):400–409. Niu D, Wang K, Wu J, et al. Can China achieve its 2030 carbon emissions commitment? Scenario analysis based on an improved general regression neural network. J Cleaner Prod. 2020; 243:118558. Dai S, Niu D, Han Y. Forecasting of energy-related CO2 emissions in China based on GM (1, 1) and least squares support vector machine optimized by modified shuffled frog leaping algorithm for sustainability. Sustainability. 2018; 10(4):958. Ding S, Dang YG, Li XM, et al. Forecasting Chinese CO2 emissions from fuel combustion using a novel grey multivariable model. J Cleaner Prod. 2017; 162:1527–1538. Yuan J, Xu Y, Hu Z, et al. Peak energy consumption and CO2 emissions in China. Energy Policy. 2014; 68:508–523. Li F, Xu Z, Ma H. Can China achieve its CO2 emissions peak by 2030? Ecol Indic. 2018;84:337–344. Sun W, Liu M. Prediction and analysis of the three major industries and residential consumption CO2 emissions based on least squares support vector machine in China. J Cleaner Prod. 2016; 122:144–153. Behera SR, Dash DP. The effect of urbanization, energy consumption, and foreign direct investment on the carbon dioxide emission in the SSEA (South and Southeast Asian) region. Renewable Sustainable Energy Rev. 2017; 70:96–106. Haseeb M, Hassan S, Azam M. Rural–urban transformation, energy consumption, economic growth, and CO2 emissions using STRIPAT model for BRICS countries. Environ Prog Sustainable Energy. 2017; 36(2):523–531. Shahbaz M, Chaudhary AR, Ozturk I. Does urbanization cause increasing energy demand in Pakistan? Empirical evidence from STIRPAT model. Energy. 2017; 122:83–93. Li B, Liu X, Li Z. Using the STIRPAT model to explore the factors driving regional CO 2 emissions: a case of Tianjin, China. Nat Hazards. 2015; 76(3):1667–1685. Yang T, Pan Y, Yang Y, et al. CO2 emissions in China's building sector through 2050: a scenario analysis based on a bottom-up model. Energy. 2017;128:208–223. Zhang Q, Yang J, Sun Z, et al. Analyzing the impact factors of energy-related CO2 emissions in China: what can spatial panel regressions tell us? J Cleaner Prod. 2017; 161:1085–1093. Wang Z, Yin F, Zhang Y, et al. An empirical research on the influencing factors of regional CO2 emissions: evidence from Beijing city, China. Appl Energy. 2012; 100:277–284. Li H, Mu H, Zhang M, et al. Analysis on influence factors of China's CO2 emissions based on Path–STIRPAT model. Energy Policy. 2011;39(11):6906–6911.