Figures & data
Figure 1. Processes considered in the greenhouse gas footprint of black tea production at UTKL.
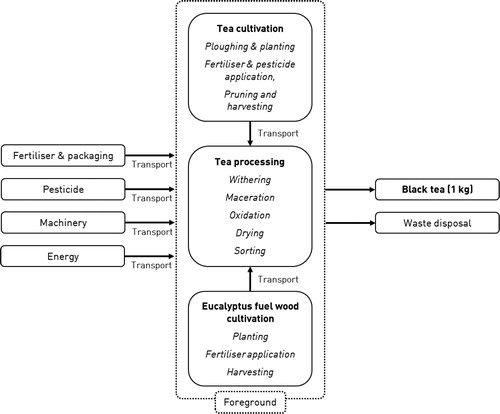
Table 1. UTKL baseline life cycle inventory to produce 1 kg of black tea.
Table 2. List of management interventions evaluation for their potential to reduce GHG emissions from tea cultivation.
Figure 2. GHG footprints for 1 kg of black tea from estates and factories around Kericho and Limuru for production years 2012 – 2015. The UTKL baseline includes an error bar to represent the temporal variability seen for the different years of production.
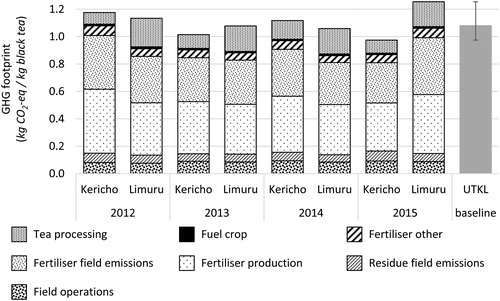
Figure 3. GHG footprint of fertiliser application (timing) and harvesting practices interventions.
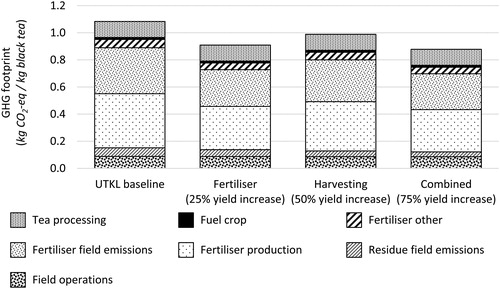
Figure 4. GHG footprint of harvesting practices intervention, considering different yield and fertiliser scenarios.
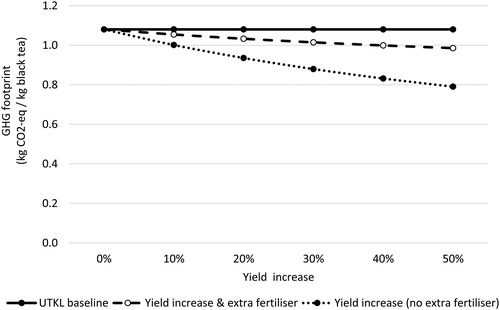
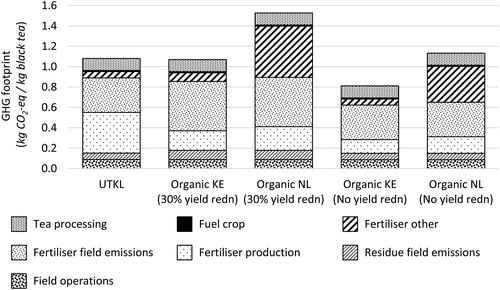
Figure 5. GHG footprint of black tea from organic tea cultivation.