
Figures & data
Figure 1. Freight transport decisions and external factors of the iron ore transport chain.
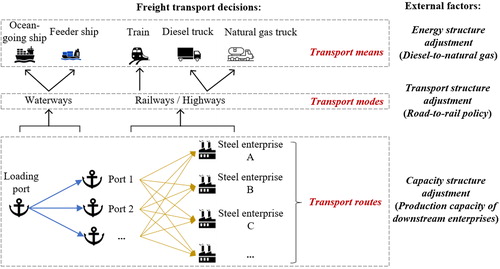
Table 1. The annual volume of iron ore imported to each BER province in 2017.
Table 2. The demand of imported iron ore of steel enterprises in the BER after capacity structure reform (10,000 tons).
Table 3. The throughput and the transport modes of imported iron ore at each port in the BER (10,000 tons).
Table 4. Distances between ports (nautical miles).
Table 5. Daily fuel consumption of each type of ship (RMB/ton).
Figure 2. Illustration of the two maritime transport sub-modes.
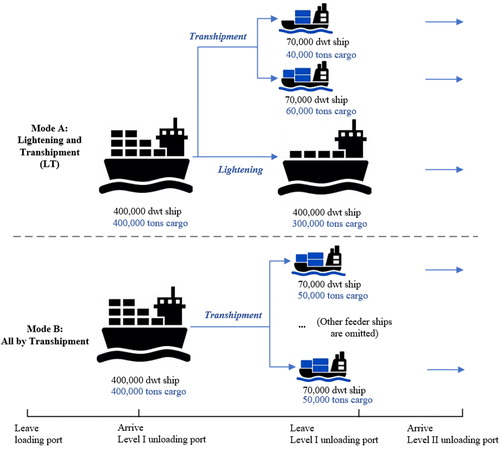
Table 6. Unit transport cost of direct transport from Tubarão Ports to the ports in the BER (RMB/ton).
Table 7. Unit transport cost between unloading ports under the LT (RMB/ton).
Table 8. Carbon and nitrogen emission factors of different transport means.
Table 9. Scenario comparison before adjusting the capacity structure.
Table 10. Scenario comparison after adjusting the capacity structure.
Figure 3. International transport part of transport plans under all scenarios.
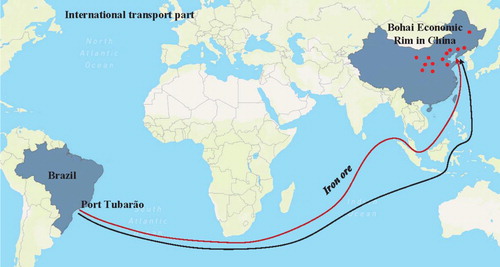
Figure 4. Domestic transport part of the transport plan under Scenario 1–6.
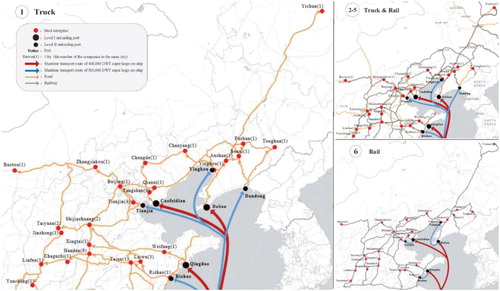
Figure 5. Domestic transport part of the transport plan under Scenario 7–12.
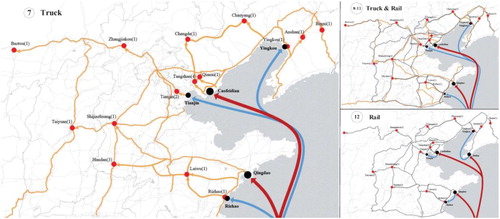
Table 11. Impact of unit transport cost reduction of railway on total transport cost (RMB 100 million yuan).
Table 12. Impact of unit transport cost reduction of railway on carbon emissions (10,000 tons).
Table 13. Impact of unit transport cost reduction of railway on nitrogen emissions (10,000 tons).