
Figures & data
Table 1. Variables description and data sources.
Figure 1. Trends of climate related-development finances, mitigation related-development finances, CO2 emissions, and renewable energy consumption in Africa. Source: Author’s construct using STATA 17
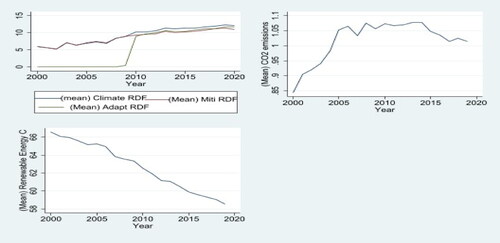
Figure 2. Scatter plots of the relationship between the overall climate-related development finances, mitigation finance, adaptation finance, renewable energy consumption and CO2 emissions in Africa. Source: Author’s construct using STATA 17
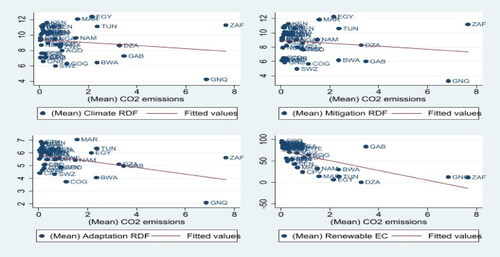
Table 2. Summary of descriptive statistics.
Table 3. Matrix of correlations.
Table 4. GMM Estimates of the effects of climate-related development finances, and renewable energy consumption on CO2 emissions.
Data availability statement
Data for the analysis can be accessed online at the following links: https://oe.cd/development-climate and https://data.worldbank.org/indicator (accessed on January 10, 2023).