Figures & data
Figure 1. The motivation-for-action model proposed by Davenport to account for the urge to cough (adapted from Davenport, Sapienza, & Bolser, 2002).
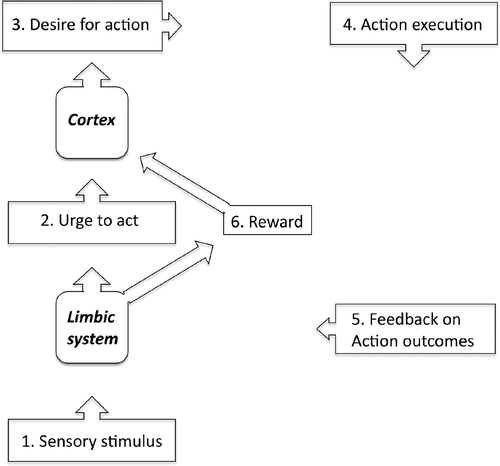
Figure 2. (A) Main results of an ALE meta-analysis of neuroimaging studies of swallowing. This analysis revealed a number of activation foci that survived conservative statistical correction (p < .05 corrected for false discovery rate). Among these were activations within the insular cortex and the dorsal mid-cingulate cortex. (B) Main results of an ALE meta-analysis of neuroimaging studies of micturition. Again this analysis revealed statistically significant foci of activation within the insular cortex and the dorsal mid-cingulate cortex.
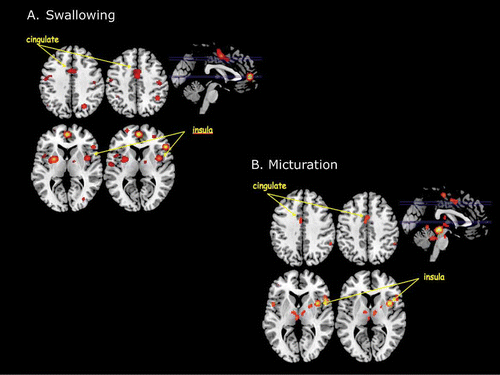
Figure 3. The results of a statistical “conjunction” analysis between the ALE meta-analyses of swallowing and micturition illustrated in . The conjunction analysis revealed only two brain areas that reached statistical threshold: the insular cortex of the right hemisphere (RH) and the mid-cingulate cortex (cingulate motor area) bilaterally.
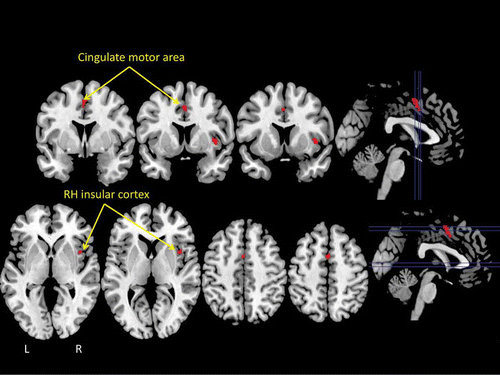
TABLE 1 Coordinates for center-of-gravity and peak activations for statistically significant clusters of activation associated with the urge to yawn
Figure 4. Regions exhibiting a statistically significant increase in blood oxygen level-dependent (BOLD) signal corresponding to the self-reported urge to yawn in an fMRI study of yawning. Again this analysis revealed statistically significant foci of activation within the insular cortex and the dorsal mid-cingulate cortex. CMA: cingulate motor area.
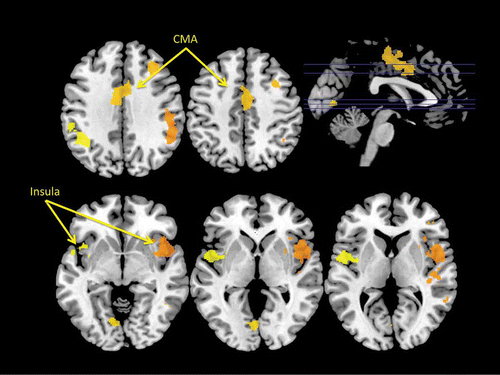
Figure 5. Regions of overlap between ALE meta-analytic studies of swallowing and micturition and fMRI studies of the urge to tic in individuals with TS (Bohlhalter et al., Citation2006) and the urge to yawn in neurologically normal adults. Again these analyses reveal regions of overlap within the insular cortex (CX) of the right hemisphere and the mid-cingulate cortex bilaterally.
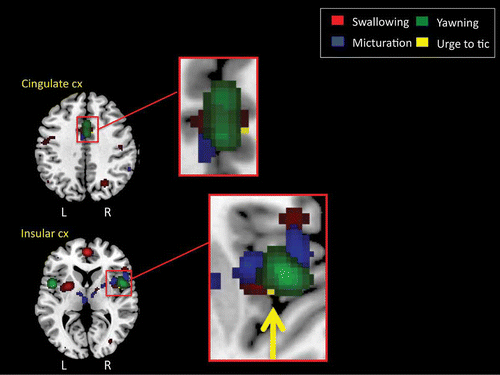
TABLE 2 Results of GCM analysis of effective connectivity for mid-cingulate cortex and right hemisphere insula “seed” regions
Figure 6. (A) Results of the effective connectivity analyses, based upon Granger causality mapping (GCM), of the yawning fMRI study. In this case, the “seed” region for the GCM has been defined as the region of the mid-cingulate cortex significantly activated during the urge to yawn. The GCM analysis revealed that regions of the anterior insula bilaterally exert a significant influence over the seed region (blue), whereas regions of the mid-insula and inferior frontal lobe bilaterally are influenced by the seed area (pink). TRA: transverse; IFG: inferior frontal gyrus. (B) Further results of the GCM analysis based upon the mid-cingulate “seed” region. The analysis also revealed that regions of the centromedial thalamus bilaterally exert a significant influence over the seed region (blue), and bilateral regions of the anterior thalamus are influenced by the seed area (pink). CMA: cingulate motor area.
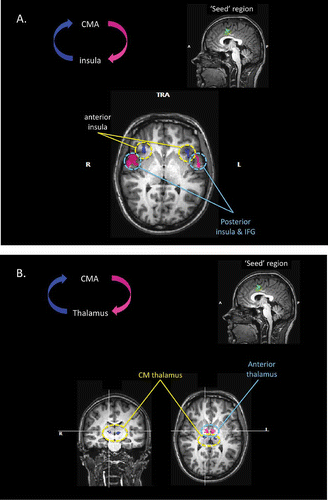
Figure 7. (A) Results of the effective connectivity analyses, based upon Granger causality mapping (GCM), of the yawning fMRI study. In this case, the “seed” region for the GCM has been defined as the region of the insular cortex of the right hemisphere that was significantly activated during the urge to yawn. The GCM analysis revealed that corresponding regions of the insular cortex within the left hemisphere, and the mid-cingulate cortex bilaterally, each exert a significant influence over the seed region (blue). CMA: cingulate motor area; TRA: transverse. (B) Further results of the GCM analysis based upon the right insula “seed” region. The analysis also revealed that regions of the centromedial thalamus bilaterally exert a significant influence over the seed region (blue), and that bilateral regions of the ventral-lateral and dorsomedial thalamus are influenced by the seed area (pink).
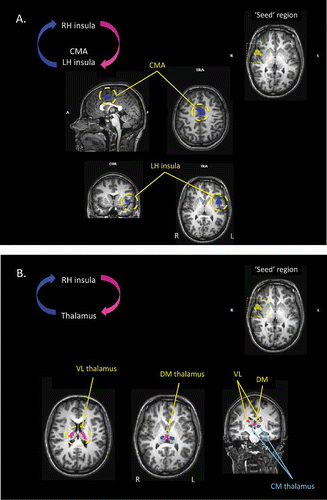
Figure 8. Main results of an ALE meta-analysis of neuroimaging studies of reward expectation (see the online supplementary material for additional information). This analysis revealed a number of activation foci that survived conservative statistical correction (p < .05 corrected for false discovery rate). Among these were activations within the insular cortex (A and C) and the dorsal mid-cingulate cortex (B).
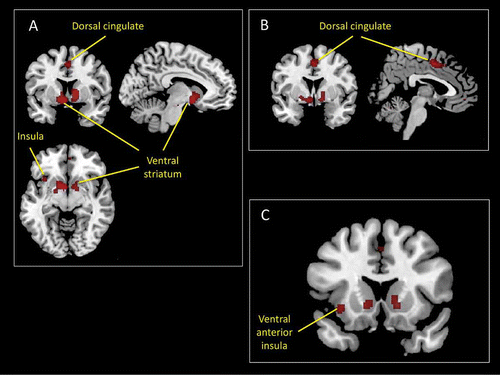
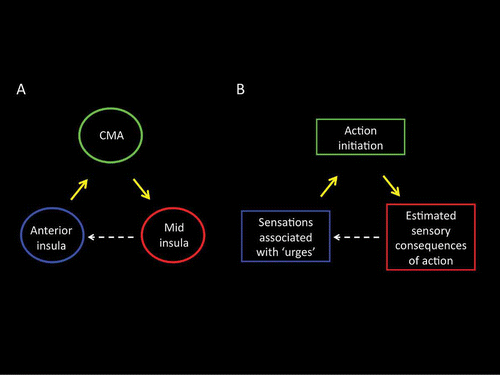
Figure 9. (A) GCM effective connectivity analyses of fMRI BOLD activations of yawning revealed a reciprocal pattern of effective connectivity between the anterior insula, the cingulate motor area, and the mid-insula. (B) On the likely function of these connections, we propose that the anterior insula may represent the urge-for-action, that the cingulate motor region may participate in the selection of an appropriate action following a cost–benefit analysis based upon the organism's past action–outcome history, and that the mid-insular cortex may evaluate, based upon a prediction of the likely outcome of the selected action, whether the conditions giving rise to the urge have been resolved, and, if appropriate, may generate a sense that the urge-for-action has been satisfied. CMA: cingulate motor area.
