Figures & data
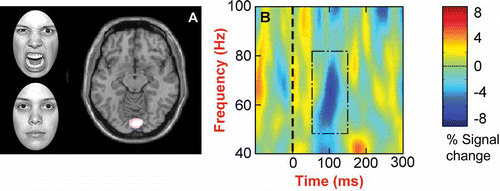
Figure 1. (A) Angry versus neutral facial expressions: a group SnPM comparison for the time window 50–250 ms demonstrates a power difference in BA 18, bilateral lingual gyrus (p < .05, 23 significant voxels; 6, –87, –12). The threshold was set at p < .10, and significant voxels (i.e., p < .05) are white in color. (B) A time-frequency plot for a significant voxel in BA 18 averaged across participants for the angry face condition demonstrates a decrease in power at approximately 100 ms within the 50–80 Hz range for the angry face stimuli. This power decrease was absent for the neutral facial expressions (results not shown).

TABLE 1 A subject-wise overview of frequency fluctuations in the gamma band in the extrastriate cortex. Subject-specific voxel coordinates (top line; bold) show the foci of gamma modulation and the direction of that modulation (PD = power decrease, PI = power increase, NC = no change) for both the right and left hemispheres. For reference, nearest Talaraich coordinates are provided (second line)
Figure 2. Time-frequency plots for a significant voxel in BA 18 for a representative individual demonstrate: (A) A power decrease at approximately 80–150 ms within the 50–80 Hz frequency range for the angry face stimuli; (B) The absence of such an effect in the neutral face stimuli time-frequency plot; and (C) The absence of such an effect in the participant's ‘grand-averaged’ time-frequency plot for the angry stimuli. This demonstrates that the power decrease observed for the angry face stimuli reflect an induced (not evoked) response. In each plot, the stimulus appeared on screen at time zero, and the red/blue colors represent percent change in power.
