Figures & data
Figure 1. Schematic illustration of trial procedure for rating and cueing trials. On rating trials before and after cueing, participants observed each face for 1000 ms after which a visual analog rating scale appeared requiring participants to click the point on the scale that represented how trustworthy they judged the face to be. During cueing trials, participants saw a fixation cross for 1500 ms, followed by a face looking directly for 1500 ms after which it changed its gaze direction and remained for 500 ms when an object appeared to the left- or right-hand side of the face and disappeared when the participant responded which also triggered the face to look back directly at the participant for another 2000 ms. Not drawn to scale. Faces reprinted with permission from the MacArthur Network.
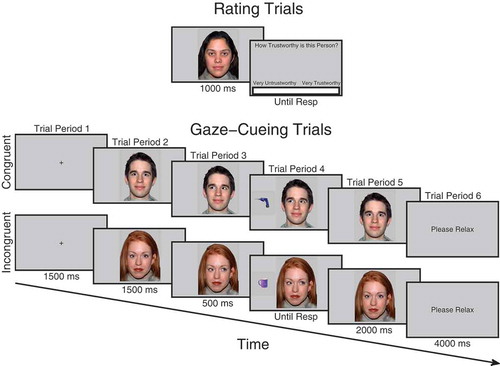
Figure 2. Mean trustworthiness ratings by validity and face gender, given before (left) and after (middle) cueing and the change in ratings (right), computed by subtracting beginning from end ratings. Error bars show ±1 standard error of the mean.
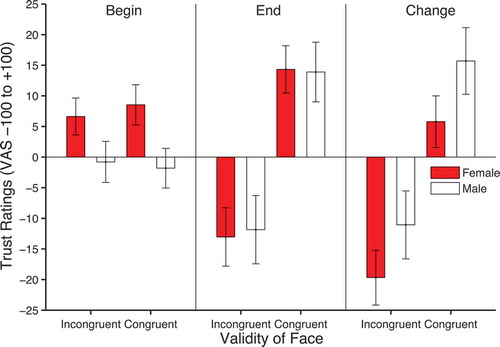
TABLE 1 Mean percentage of trials containing errors, outliers, and artifacts across conditions in experiment 1
Figure 3. Mean reaction times on congruent and incongruent trials across blocks within participants who did (left panel) and did not show trust effects (right panel). Error bars show +/-1 standard error of the mean.
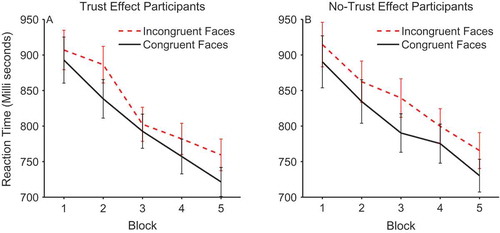
Figure 4. Mean stimulus-locked corrugator activity on congruent (solid line) and incongruent trials (dashed line) for trust effect (left panels) and no-trust effect (right panels) participants across trial periods 2, 3, 4, and 5 (rows). EMG units on the y-axis represent the ratio of activity relative to baseline (fixation). Error bars show ±1 standard error of the mean.
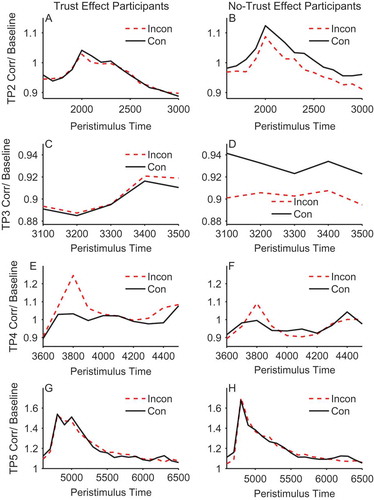
Figure 5. Mean stimulus-locked zygomaticus activity on congruent (solid line) and incongruent trials (dashed line) for trust effect (left panels) and no-trust effect participants (right panels) across trial periods 2, 3,4, and 5 (rows). EMG units on the y-axis represent the ratio of activity relative to baseline (fixation). Error bars show ±1 standard error of the mean.
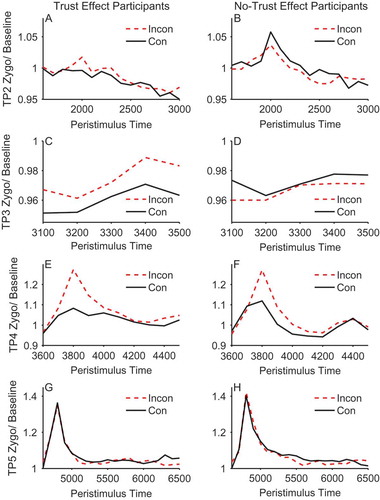
Figure 6. Mean corrugator activity across blocks for trust effect participants (left panels) and no-trust effect participants (right panels) in trial period 2 (top), trial period 3 (middle) and trial period 4 (bottom). Dashed lines represent incongruent and solid lines congruent. EMG units on the y-axis represent the ratio of activity relative to baseline (fixation). Error bars show ±1 standard error of the mean.
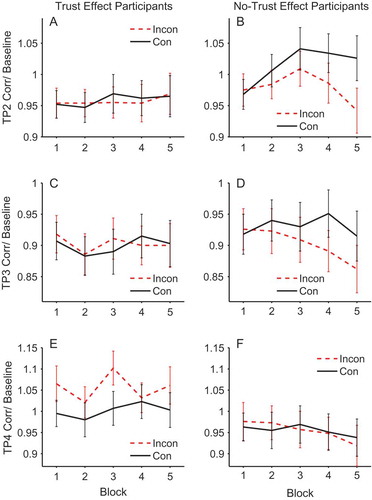
Figure 7. The 16 arrows in their neutral state used in experiment 2.
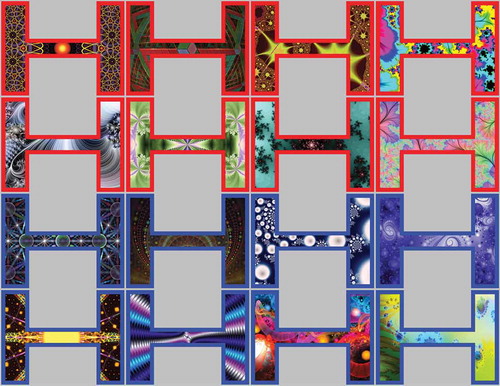
Figure 8. Trial procedure on rating and cueing trials for experiment 2 using arrows. On rating trials before and after cueing, participants observed each arrow/shape for 1000 ms after which a visual analog rating scale appeared requiring participants to click the point on the scale that represented how much they liked the arrow/shape. During cueing trials, participants saw a fixation cross for 1500 ms, followed by an arrow/shape in its neutral state for 1500 ms, after which it changed shape to point to the left or right for 500 ms when an object appeared to the left- or right-hand side and disappeared when the participant responded. This also triggered the arrow to go back to its neutral state for another 2000 ms.
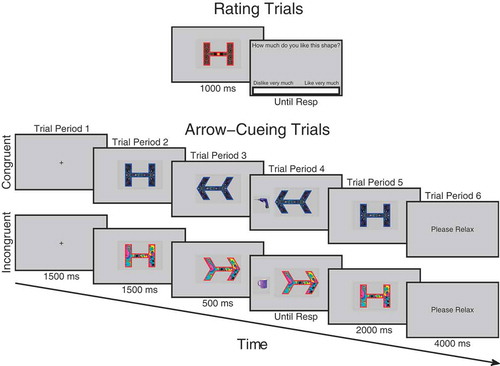
TABLE 2 Mean percentage of trials containing errors and outliers across conditions in experiment 2
Figure 9. Liking ratings of congruent and incongruent arrows before (left panel) and after (middle panel) cueing and the change in ratings computed by subtracting beginning from end ratings (right panel). Error bars show +/-1 standard error of the mean.
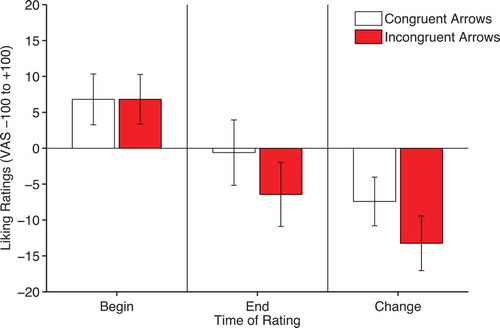
Figure 10. Mean arrow-cueing reaction times on congruent and incongruent trials across blocks. Error bars show +/-1 standard error of the mean.
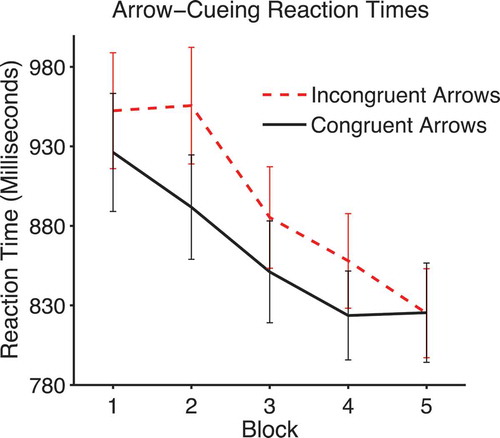
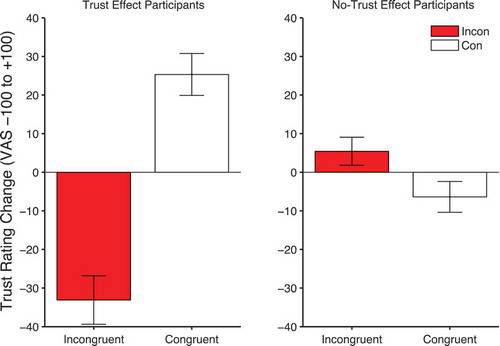
Figure 11. Mean change in trust ratings (end-beginning) for congruent and incongruent conditions in trust effect (left panels) and no-trust effect participants (right panels). Error bars show +/-1 standard error of the mean.