Figures & data
Figure 1. Right and superior display of the IPC division to rostral (yellow-red), middle (cyan), and caudal (violet) parts
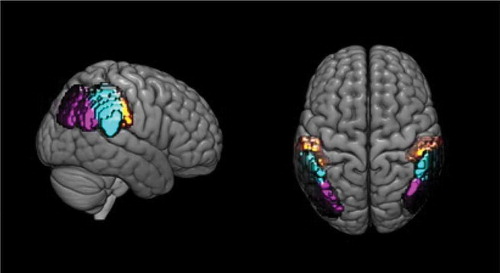
Table 1. Details of the participants included in the analysis
Table 2. Summary of each variable that the stimuli were matched on in L1 & L2 with t-test statistics
Figure 2. L1 and L2 RTs in millisecond in the switch and non-switch contexts in both the by-participants and the by-item analyses. As shown in this figure, in both switch and non-switch contexts L2 lexical production is quicker than L1 lexical production, with symmetrical switch costs. The error bars represent SEs
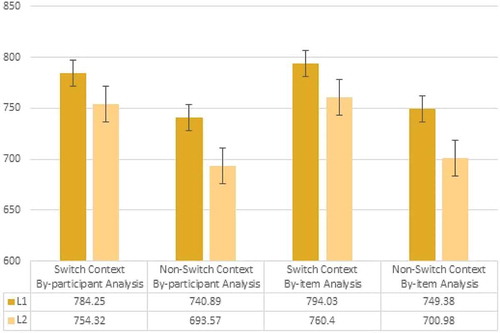
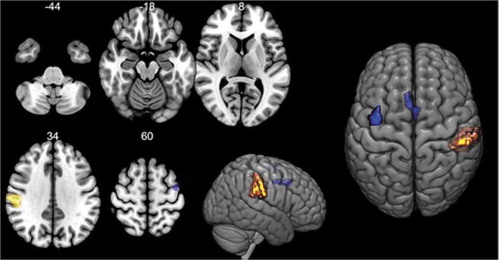
Figure 3. Showing clusters with positive and negative functional association with the right IPC rostral cluster as a result of switching to L1. In this figure, the location of the right IPC rostral cluster, as the seed region, is shown in yellow-red. Clusters with negative functional associations with the seed region, localized in the precuneus cortex and the postcentral gyrus are shown in green. A cluster localized in the cerebellum, posterior lobe, declive with positive functional association with the seed region is displayed in blue
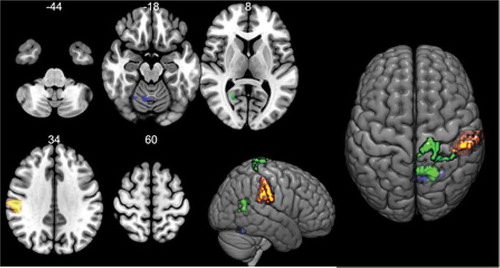
Table 3. Clusters exhibiting functional connectivity with the rostral IPC R/L seed as a result of switching to L1/L2
Figure 4. Showing clusters with negative functional association with the left IPC rostral cluster as a result of switching to L1. In this figure, the location of the left IPC rostral cluster, as the seed region, is shown in yellow-red. Clusters with negative functional associations with the seed region, localized in the precuneus cortex and the superior frontal gyrus are shown in green
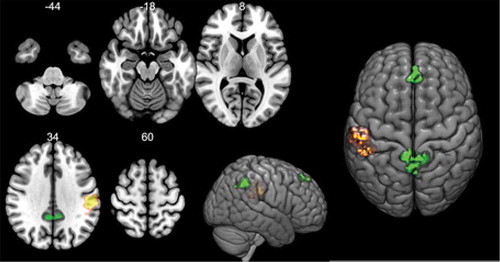
Figure 5. Showing clusters with positive functional association with the right IPC rostral cluster as a result of switching to L2. In this figure, the location of the right IPC rostral cluster, as the seed region, is shown in yellow-red. Clusters with positive functional associations with the seed region, localized in the cingulate gyrus anterior division, and localized in the precentral gyrus are shown in blue