Figures & data
Table 1. Selected points of intervention studied.
Figure 1. Ethanol consumption under different scenarios from 2010 to 2035.
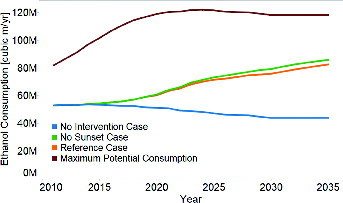
Figure 2. Variations of the reference policy case, where just one of the policies comprising it is ‘turned off’ with cellulosic ethanol production levels in 2020 and 2035.
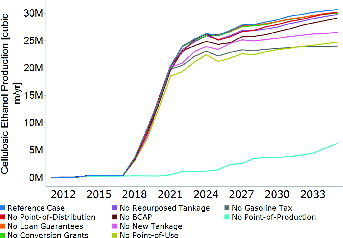
Figure 3. Simulated potential cumulative government spending (relative to 2010) on incentives in the reference case versus no sunset case. ‘Loan guarantee exposure’ does not represent actual spending, but rather the potential cost of defaults of loans guaranteed by the government; ‘downstream’ combines ethanol storage, distribution, and end-use.
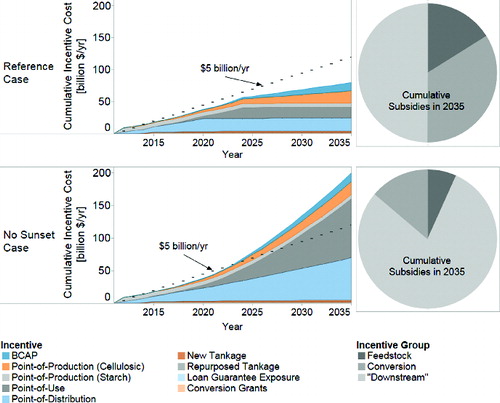
Table 2. The ‘reference incentive case’: inputs that produce a moderate, sustained industry takeoff.
Figure 4. Total ethanol production under progress ratios of 75% to 95%.
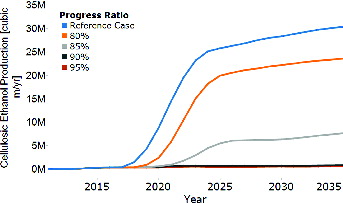
Figure 5. Effect of removing downstream infrastructure constraints. ‘Full Coverage’ refers to a scenario where all storage terminals and dispensing stations can handle ethanol.
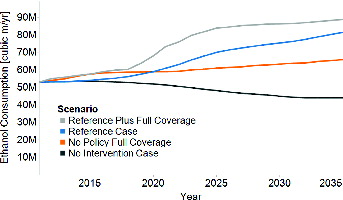
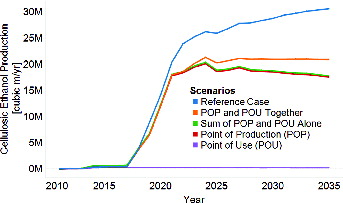
Figure 6. Synergistic effect of policies on cellulosic ethanol production.