Figures & data
Figure 1. Schematic showing typical yield locus and effective yield locus for a material that has been subjected to maximum consolidation pressures σ1 and σ2 (resulting in a steady bulk density ρb, assuming that elastic recovery is negligible).
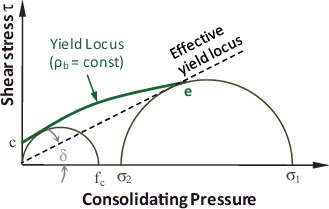
Table 1. Switchgrass samples prepared during DOE's high-tonnage switchgrass project led by Genera Energy in 2010–13.
Figure 2. Adjustable-outlet hopper. (a) Top view; (b) end-view; (c) weights positioned on vertical rod; and (d) schematic showing position of weights, rods, material, bottom board and mass scale.
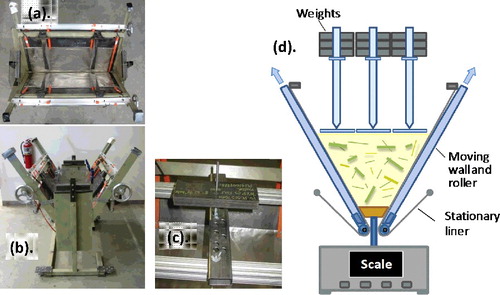
Figure 3. Cumulative particle width distributions (CPDs) for two ground samples and two chopped samples as measured using a Clemex digital image analyzer (cam) and sieve analysis (sieve). Horizontal dashed lines indicate the 10, 50, and 90% cumulative passing percentiles. Hybrid Width (HW) and sieve side width were used as the width parameters for the digital imaging and sieve analyses, respectively. For digital imaging analyses, repeatability bars indicate the standard deviation of three replicates; for sieve analyses repeatability bars indicate the difference between duplicate tests.
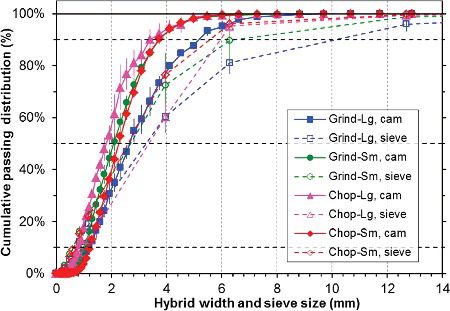
Table 2. Particle size distribution statistics from the image and sieve analyses. Sieve results are the average of two separate measurements. For digital imaging analyses, values in parenthesis indicate the standard deviation of three replicates; for sieve analyses, values in parenthesis indicate the difference between duplicate analyses.
Figure 4. Representative images obtained from a Keyance digital microscope (2500X magnification) of particles from samples Grind-Lg and Grind-Sm (both ground).
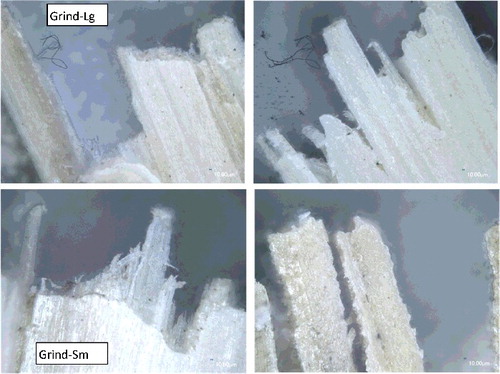
Figure 5. Representative images obtained from a Keyance digital microscope (2500X magnification) of particles from samples Chop-Lg and Chop-Sm (both chopped).
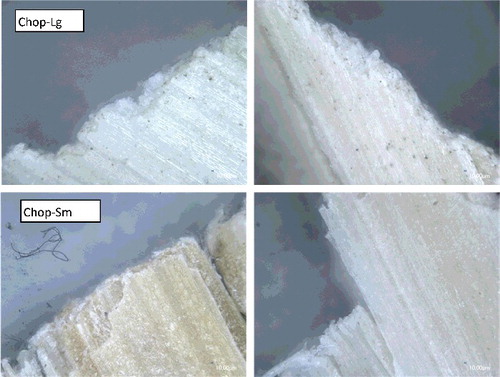
Figure 6. Measured shear stresses at incipient flow as functions of compressive stress for two ground and two chopped samples. Preshear normal stress is 0.5 kPa for all measurements. Data was obtained using an automated Schulze ring shear tester (25.4 cm outer diameter).
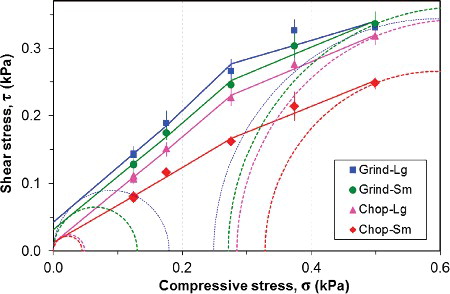
Table 3. Summary of rheological properties obtained from a Schulze automated shear tester and a larger custom-built shear cell. FFC = σ1/fc. NA = Not available (extrapolation of yield locus to shear stress axis resulted in a negative value). Numbers in parenthesis in column 2 (“Sample”) indicate the number of tested samples. Numbers in parenthesis in other columns indicates the standard deviation of the test result.
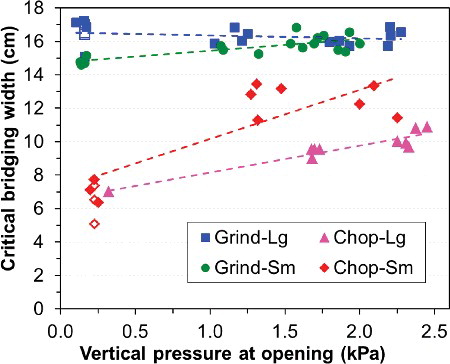
Figure 7. Measured critical arching widths of two ground and two chopped samples as functions of the measured force on the central board placed at the bottom of the hopper. Results from tests without boards are also included as hollow symbols, and for these tests abscissa values were set equal to the average value of similar tests conducted with boards.