
Figures & data
Table 1. Ethanol production market breakdown and animal feed displacement by ethanol plant type.
Table 2. Domestic land-use change emissions for GTAP 2013 simulation using emission factors from Century/COLE, Woods Hole, and Winrock International.
Table 3. Methane emission factors from irrigated rice by region (in kg CO2e/ha).
Table 4. Changes in population, emission factors, and total emissions by livestock type.
Table 5. Reduced Methane Emissions from Distillers Grains as Animal Feed by Ethanol Plant Type.
Table 6. iLUC emissions by scenario, emissions factor set, and annualized emissions value.Table Footnotea
Table 7. Mode and distance assumptions.
Table 8. Assumptions and inputs for fuel production modeling in GREET 2015.
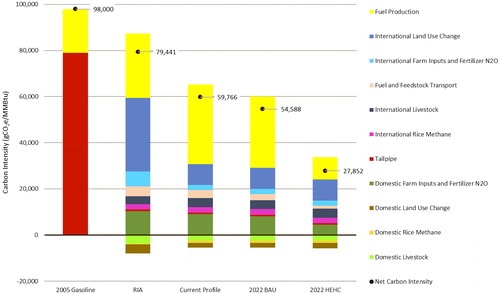
Figure 1. Life-cycle GHG emissions for gasoline and corn ethanol by scenario and source category. RIA: Regulatory Impact Analysis; BAU: Business as Usual Scenario; HEHC: High Efficiency - High Conservation Scenario; N2O: Nitrous Oxide.
Appendix Table A1. Summary of Key Data Sources and Models Used in the Regulatory Impact Analysis (RIA) Life Cycle Analysis and the Current Greenhouse Gas (GHG) Profile.
Appendix Table A2. Emissions by scenario and category.