
Figures & data
Figure 1. Description of methods and outputs of the study.
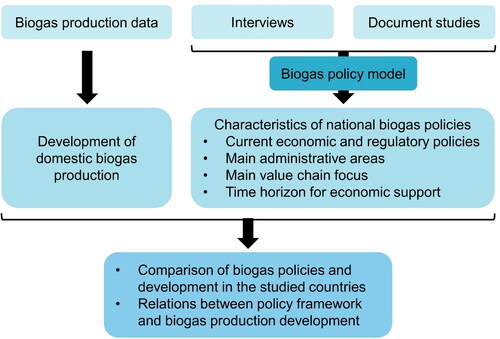
Table 1. List of studied countries and motivation for selection.
Figure 2. Comprehensive illustration of the dimensions in the implemented policy model. Based on the work of Gustafsson and Anderberg [Citation39].
![Figure 2. Comprehensive illustration of the dimensions in the implemented policy model. Based on the work of Gustafsson and Anderberg [Citation39].](/cms/asset/9009152a-0947-458b-b043-f999f430ec48/tbfu_a_2034380_f0002_c.jpg)
Figure 3. Annual biogas production per capita in the studied countries. Calculated from [Citation20] and [Citation47].
![Figure 3. Annual biogas production per capita in the studied countries. Calculated from [Citation20] and [Citation47].](/cms/asset/a52b87b0-dd92-49ca-8c69-4123be90b985/tbfu_a_2034380_f0003_c.jpg)
Table 2. Comparison of biogas production and some fundamental conditions for biogas solutions in the studied countries.
Figure 4. Development of domestic biogas production in the studied countries. The production level for each year is plotted relative to the 2019 level in the respective country.
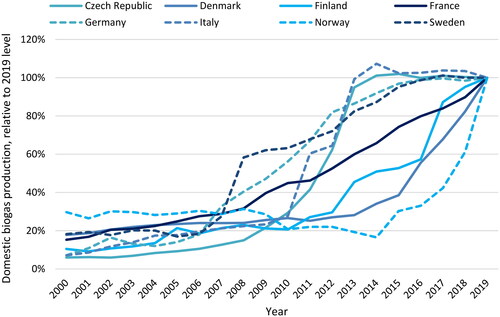
Table 3. Comparison of biogas policies in the studied countries, based on the model by Gustafsson and Anderberg [Citation39].