Figures & data
Figure 1. Particle size distribution of corn stover 2 mm and Douglas fir 1 mm.
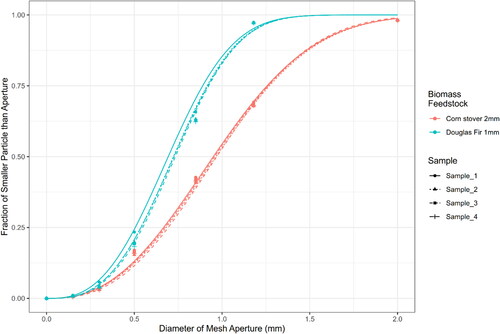
Figure 2. Biomass-scale cubical triaxial tester developed by Forest Concepts, LLC and Pennsylvania State University.
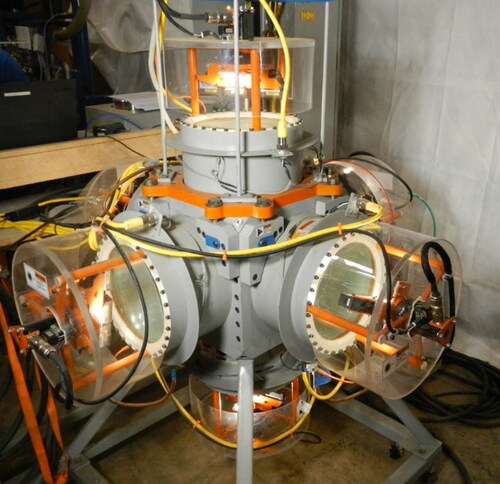
Figure 3. Bulk density values of biomass feedstock samples measured with containers of different volumes. ISO small and ISO large container volumes are 0.0046 m3 and 0.0326 m3, respectively. Containers (200, 250, 300 and 400 mm) are cubes represented by the length of edges, and the volumes of these containers are 0.008 m3, 0.016 m3, 0.027 m3 and 0.064 m3, respectively.
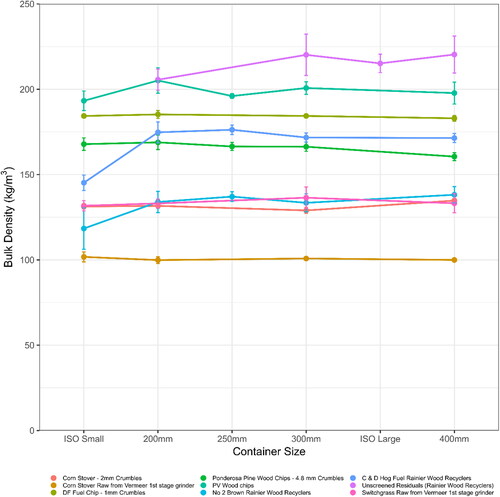
Figure 4. Hydrostatic triaxial compression (HTC) test (a) depicts the schematic of isotropic stress condition where and
represent stress in x, y and z directions, respectively, and
and
represent stress increment in x, y and z directions, respectively. (b) The HTC stress paths with three unloading-reloading isotropic stress paths ending with the final unloading. Volumetric strain response to an unloading-reloading isotropic stress path allows the determination of bulk mechanical properties relevant to the hydrostatic compression.
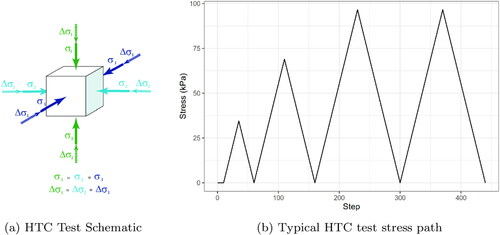
Figure 5. Conventional Triaxial compression (CTC) test (a) depicts the schematic of isotropic consolidation followed by deviatoric stress in the vertical direction. Here, and
represent stress in x, y and z directions, respectively, and
and
represent stress increment in x, y and z directions, respectively. (b) The CTC stress paths with the consolidation stress of 34.5 kPa (5 psi) followed by two unloading-reloading deviatoric stress paths ending with the final unloading. Deviatoric strain response to an unloading-reloading deviatoric stress path allows the determination of bulk mechanical properties relevant to the shear.
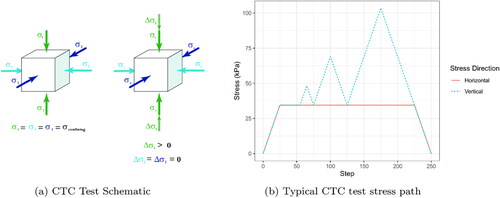
Figure 6. Typical conventional triaxial test results of corn stover 2 mm and Douglas fir 1 mm.
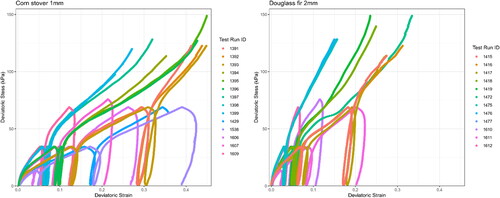
Figure 7. Failure shear stress trend of corn stover 2 mm (CS C2mm) and Douglas fir 1 mm (DF C1mm) at air-dried moisture content. A box and whiskers represent the first, second, third, and fourth quantiles with a mean value shown as a solid point. Data points outside the first or fourth quantile represent outlier.
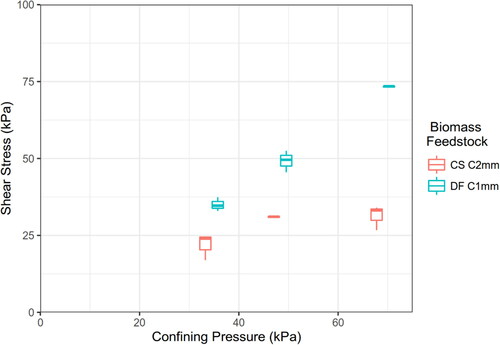
Figure 8. Mohr-Coulomb failure envelopes of air-dried corn stover 2 mm and Douglas fir 1 mm with consolidation stress levels (represented as normal stress) of 34.5, 48.3 and 69.0 kPa, respectively. Red lines demonstrate Mohr-Coulomb failure envelopes that are common tangential lines of two Mohr circles.
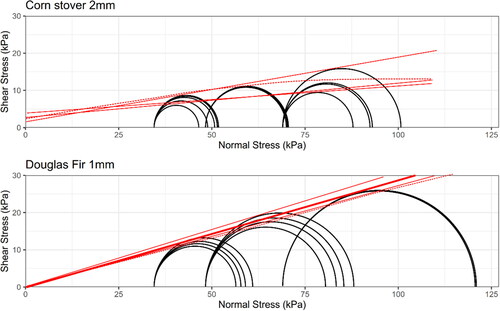
Figure 9. Mohr-Coulomb model parameters of air-dried corn stover 2 mm (CS C2mm) and Douglas fir 1 mm (DF C1mm) as box plots. A box and whiskers represent the first, second, third and fourth quantiles with a mean value shown as a solid point. Data points outside the first or fourth quantile represent outlier. The smaller angle of internal friction value of corn stover 2 mm suggests that corn stover 2 mm gains less strength than Douglas fir 1 mm. However, the larger variation of corn stover 2 mm suggests potential issues in handling. On the other hand, the close to zero cohesion coefficient of Douglas fir 1 mm indicates a good handling characteristic.
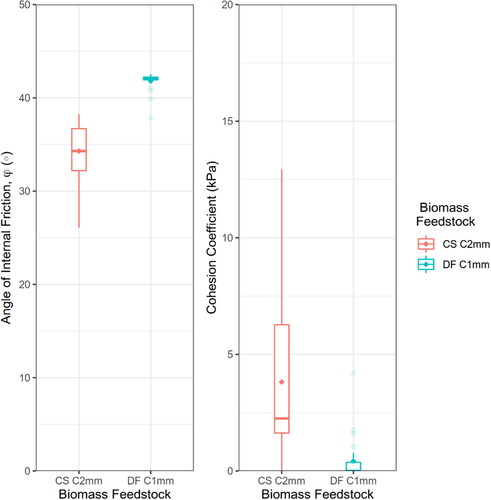
Figure 10. Failure deviatoric stress and hydrostatic stress of corn stover 2 mm (CS C2mm) and Douglas fir 1 mm (DF C1mm) at air-dried moisture content. A box and whiskers represent the first, second, third and fourth quantiles with a mean value shown as a solid point.
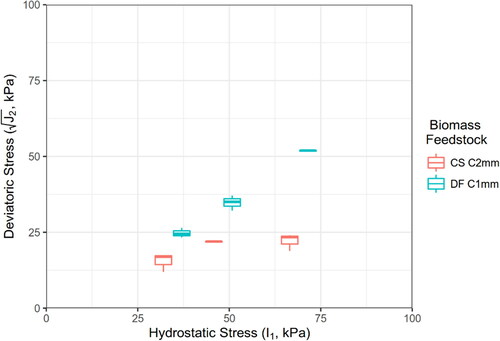
Figure 11. Drucker-Prager model parameters of air-dried corn stover 2 mm (CS C2mm) and Douglas fir 1 mm (DF C1mm). The smaller β of corn stover 2 mm suggests that corn stover 2 mm gains less strength than Douglas fir 1 mm. However, the smaller R2 value of corn stover 2 mm suggests potential issues in handling. On the other hand, the close to zero d value of Douglas fir 1 mm indicates a good handling characteristic. These observations are consistent with the Mohr-Coulomb parameters.
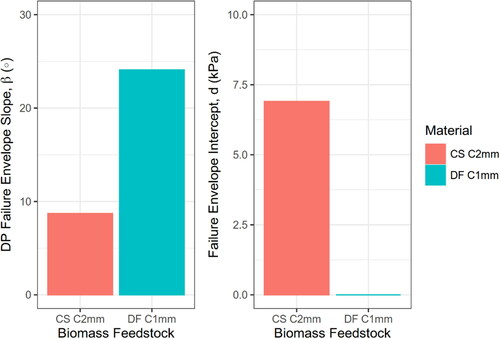
Figure 12. Conventional Triaxial Compression (CTC) test results in volumetric strain versus q/p (ratio between deviatoric stress, q, and hydrostatic stress, p) of air-dried corn stover 2 mm (CS C2mm) and Douglas fir 1 mm (DF C1mm).
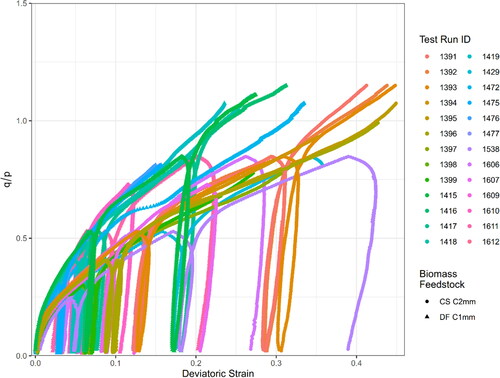
Figure 13. Hydrostatic Triaxial Compression test results in void ratio versus (Isotropic Stress (kPa)) versus the void ratio of air-dried corn stover 2 mm and Douglas fir 1 mm.
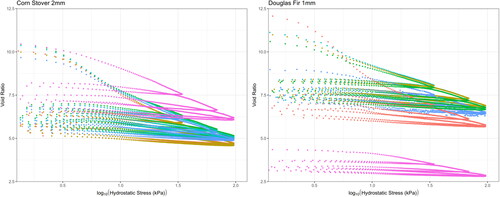
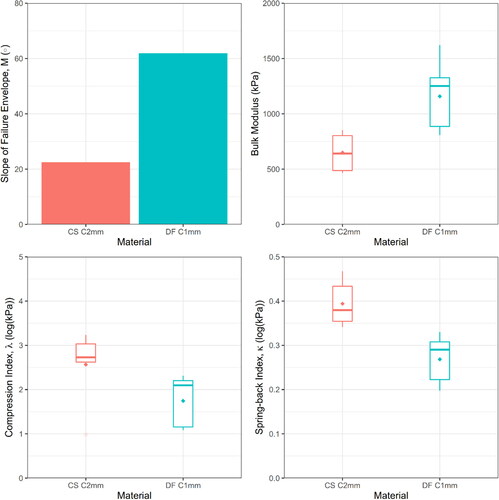
Figure 14. Modified Cam-Clay parameters of air-dried corn stover 2 mm and Douglas fir 1 mm: (a) Slope of the critical-state line, which represents the failure envelope, (b) bulk modulus (K), (c) compression index (l) and (d) spring-back index (k).