Figures & data
Table 1. Simulation parameters.
Figure 1. Air volume entrainment computations by subdivided conical segments.
r(i): integral element's inner radius: r(i+1): integral element's outer radius: ΔX: integral element's thickness.
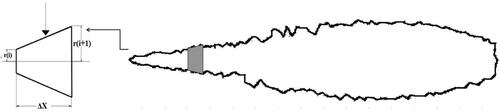
Figure 2. A schematic of the air mass flow exchange from the cone surface area.
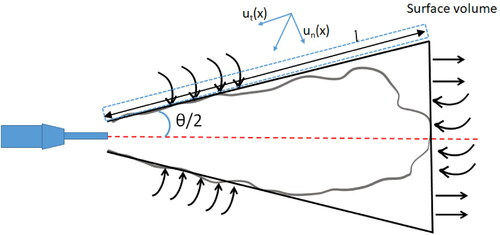
Figure 3. Discretized geometry of the combustion chamber.
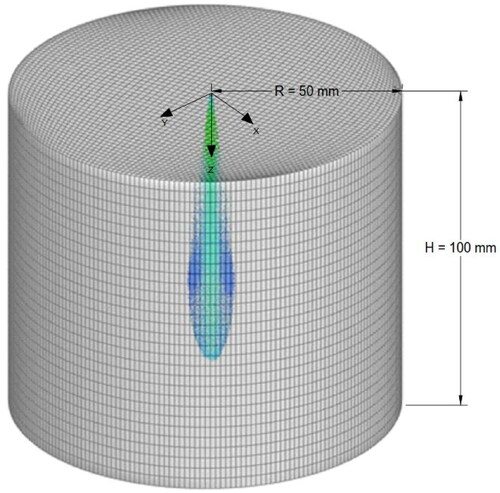
Table 2. Numerical simulation conditions.
Figure 4. Comparison of experimental [Citation37] and calculated results for (a) biodiesel penetration length and (b) biodiesel SMD.
![Figure 4. Comparison of experimental [Citation37] and calculated results for (a) biodiesel penetration length and (b) biodiesel SMD.](/cms/asset/c3eb1c4e-ddf6-429e-b306-7a73c4164374/tbfu_a_2105867_f0004_c.jpg)
Table 3. Fuel properties of diesel and SME biodiesel in a continuous phase spray simulation [Citation38].
Figure 5. SMD vs. liquid mass evaporation for different fuels at 293, 350 and 400 K fuel temperatures.
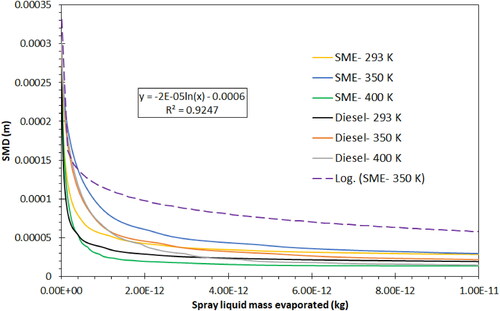
Figure 6. (a) Accumulated air entrainment for biodiesel and diesel fuels; (b) air entrainment rate for different breakup models; (c) air entrainment rates for biodiesel and diesel fuels.
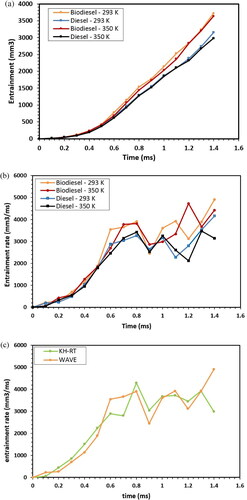
Figure 7. Average normal velocity of entrained air, for biodiesel and diesel fuels.
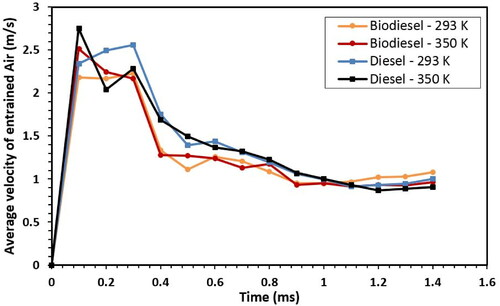
Figure 8. (a) Two-dimentional spray plume and Y-velocity component of local entrained air, at spray plume surface at 1.4 ASOI; (b) Y-velocity component of instantaneous entrained air, for biodiesel and diesel fuels, with respect to the distance from nozzle tip.
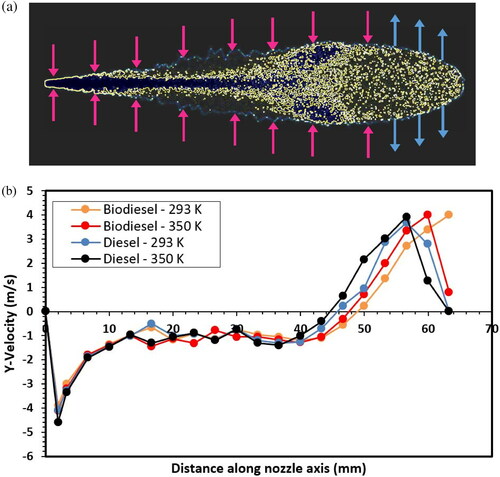
Figure 9. Y-velocity component of locally entrained air, for biodiesel and diesel, in different surfaces corresponding to different liquid densities.
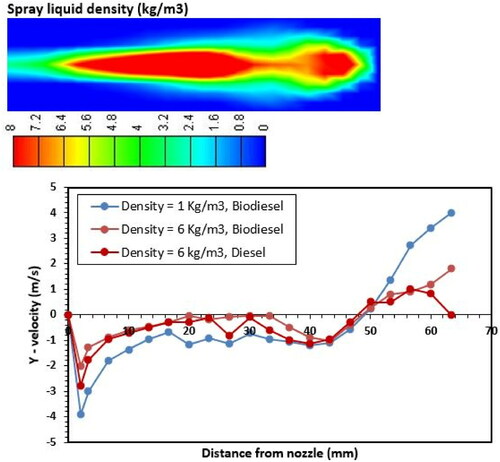
Figure 10. Temporal variation in the air exchange rate for (a) different fuels and temperatures, and (b) breakup models.
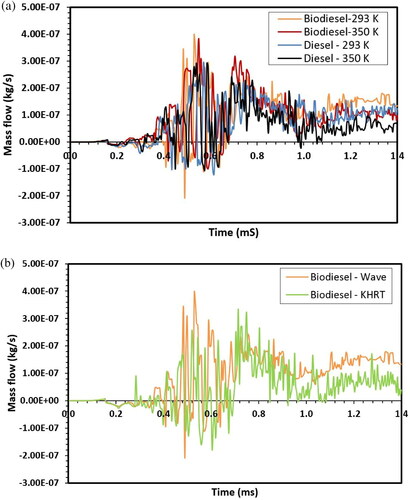
Figure 11. Scaled instantaneous air mass flow to spray boundary corresponding to ρl = 3.0 kg/m3 for diesel and biodiesel at different fuel temperatures of 293 and 350 K.
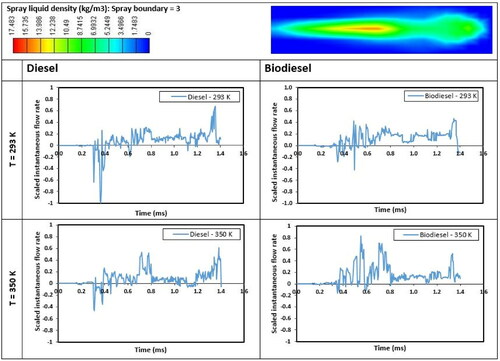
Figure 12. Normalized parcel density distribution along spray plume axis: (a) fuel type effect; (b) fuel temperature effect; (c) breakup model effect.
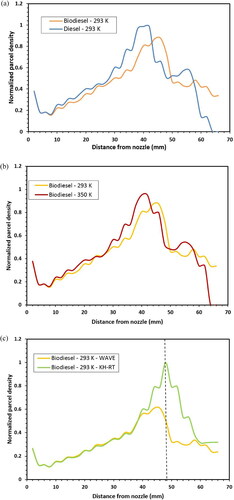
Figure 13. (a) Penetration and (b) SMD vs. fuel temperature.
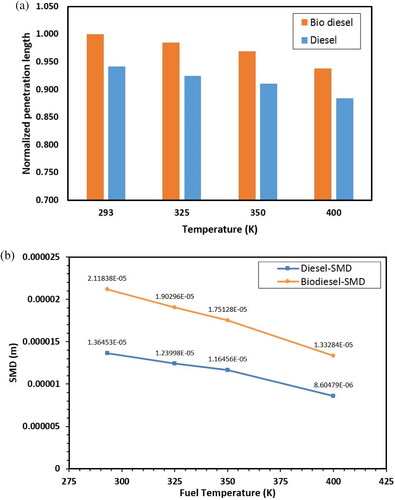
Figure 14. Volume-weighted cumulative size distribution of (a) biodiesel and (b) diesel.
Figure 15. (a) Variation of spray cone angle with fuel temperature and (b) maximum liquid We number with time.
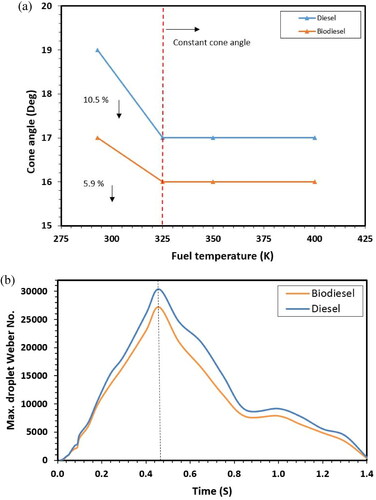
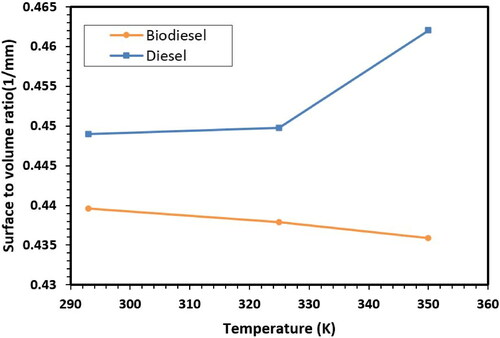
Figure 16. Ratio of spray surface area to air entrainment volume.