
Figures & data
Figure 1. The Swedish biogas market 2005–2020 by source [Citation40].
![Figure 1. The Swedish biogas market 2005–2020 by source [Citation40].](/cms/asset/e0880698-76fc-435c-9ead-f47a60565a21/tbfu_a_2121543_f0001_c.jpg)
Figure 2. Overview of the methodology of the study.
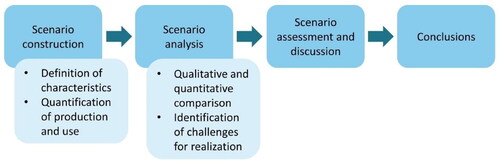
Figure 3. Overview of the scenario development process.
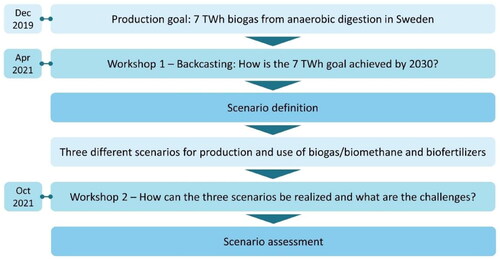
Table 1. Summary of the three scenarios for production and use of biogas/biomethane and biofertilizers.
Figure 4. Biogas production in 2020 and the three future scenarios by type of feedstock.
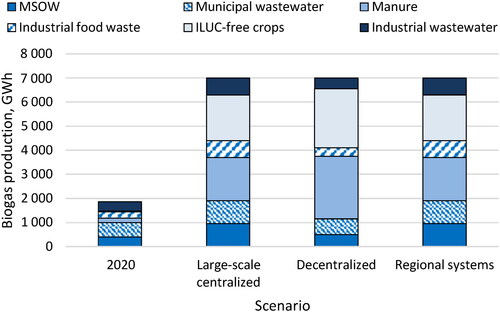
Figure 5. Number of biogas plants and total digester volume by type of production plant in 2020 and the three future scenarios.
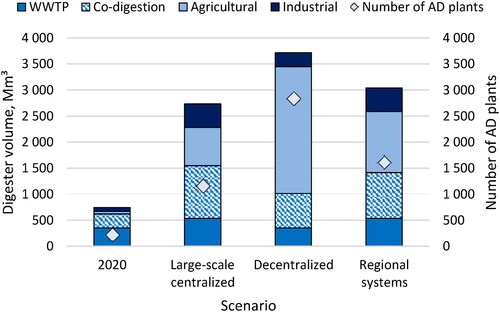
Figure 6. Biogas production in 2020 and the three future scenarios by type of production plant.
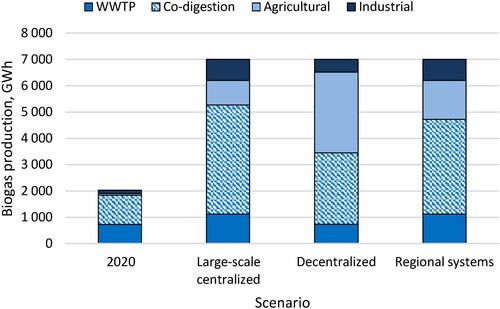
Figure 7. Biofertilizer production in 2020 and the three future scenarios by type of production plant.
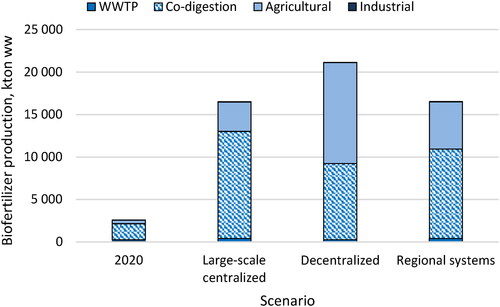
Figure 8. Use of biogas and biomethane in 2020 and the three future scenarios.
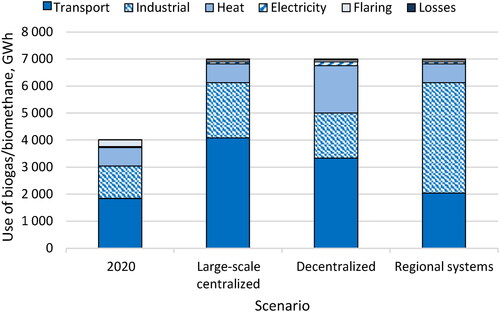
Table A1. Division of substrates per type of biogas plant in 2020 [Citation51] and the three future scenarios.
TABLE A2. Biogas yield and production potential per substrate type.
Table A3. Typical properties (2020 average) of different types of biogas plants in Sweden.