
Figures & data
Table 1. Fuel properties of Argemone mexicana biodiesel (AMB), and American society for testing and materials (ASTM) standard methods adopted.
Figure 1. Scanning electron micrographs of synthesised nanoparticles: (a) 0.5 µm × 5000; (b) 0.5 µm × 10,000; (c) 1 µm × 5000; (d) 1 µm × 10,000.
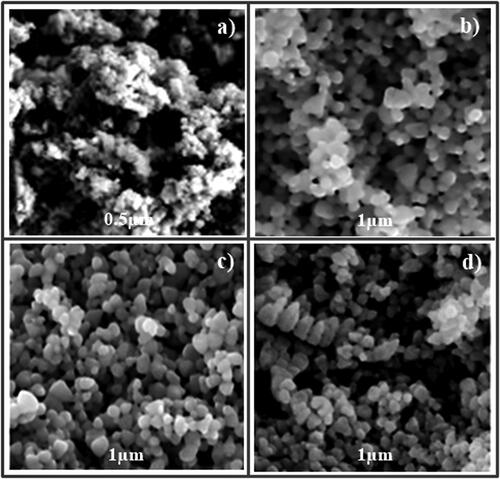
Figure 2. (a) XRD spectrum of CaO nanoparticles; (b) thermal gravimetric analysis (TGA) and differential scanning calorimetry (DSC); (c) FT-IR spectra of CaO nanoparticles.
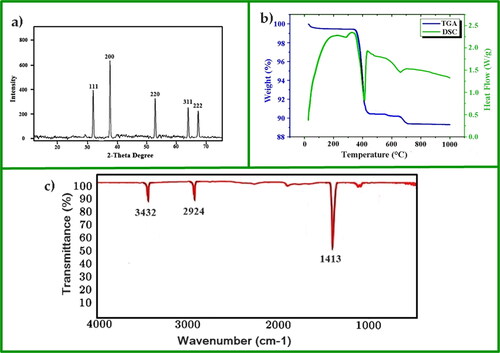
Figure 3. Parametric optimisation of biodiesel yields: (a) the effect of oil-to-methanol ratio; (b) the effect of catalyst dosage; (c) the effect of reaction temperature; (d) the effect of reaction time.
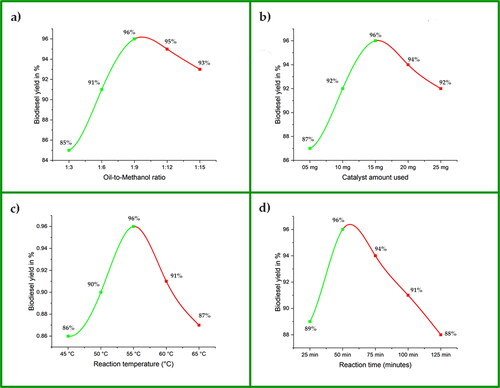
Figure 4. (a) Catalytic activity of recycled CaO nanoparticles; (b) scanning electron micrograph of CaO nanoparticles after the fifth recovery.
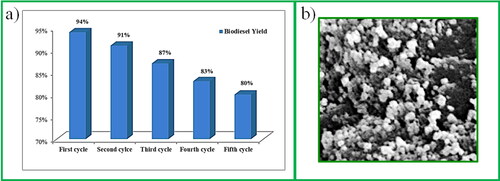
Figure 5. Spectroscopic analysis of the synthesised biodiesel: (a) 1H-NMR spectrum; (b) 13C-NMR spectrum; (c) GC-MS spectrum; (d) FT-IR spectrum.
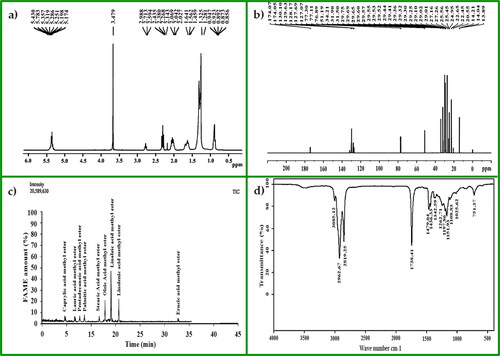
Table 2. Reported FAMEs, retention time, and percentage.
Table 3. Various functional groups and their peaks identified in the FT-IR spectrum of biodiesel.
Data availability statement
All the data are given in the article.