2,373
Views
27
CrossRef citations to date
0
Altmetric
Research Articles

Time and frequency behaviour in TSR and PPT evaluation for flash thermographyFootnote*

Pages 164-184 | Received 24 Aug 2016, Accepted 04 Jan 2017, Published online: 01 Feb 2017

Figures & data

Figure 1. Comparison of the phase calculated by Fourier transformation and by FFT for a semi-infinite body (fs = 50 Hz) after a Dirac delta heating and under adiabatic circumstances.
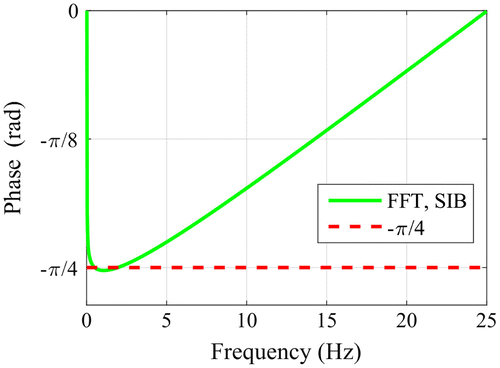
Figure 1. Comparison of the phase calculated by Fourier transformation and by FFT for a semi-infinite body (fs = 50 Hz) after a Dirac delta heating and under adiabatic circumstances.

Figure 2. Phase of the surface temperature of a finite body obtained by Fourier transformation according to Equation (Equation10); a: on the x-axis is the dimensionless x parameter which is the double of the so-called thermal thickness; b: calculated for two different thicknesses using typical steel parameters.
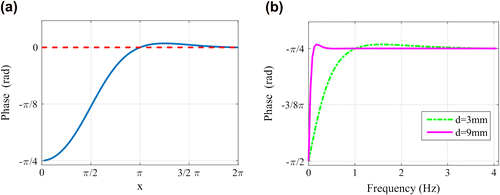
Figure 2. Phase of the surface temperature of a finite body obtained by Fourier transformation according to Equation (Equation10(10) ); a: on the x-axis is the dimensionless x parameter which is the double of the so-called thermal thickness; b: calculated for two different thicknesses using typical steel parameters.

Figure 3. a: Phase of the surface temperature calculated by FFT (fs = 50 Hz) for semi-infinity body and for two finite bodies; b: the same curves as in Figure a but in close up for the same range of 0–4 Hz as in Figure (b).
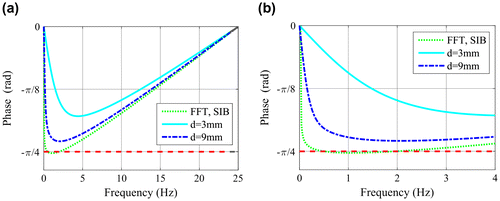
Figure 3. a: Phase of the surface temperature calculated by FFT (fs = 50 Hz) for semi-infinity body and for two finite bodies; b: the same curves as in Figure a but in close up for the same range of 0–4 Hz as in Figure 2(b).

Figure 4. a: Normalised temperature increase after a Dirac delta heating; b: phase of a thermal wave in the same finite body.
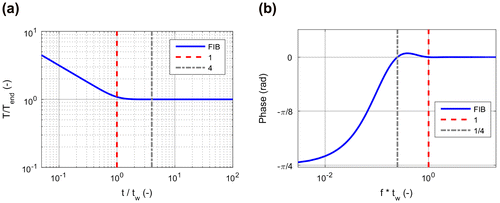
Figure 4. a: Normalised temperature increase after a Dirac delta heating; b: phase of a thermal wave in the same finite body.

Figure 5. Phase of thermal waves for a defect depth of d = 3 mm, for a sound thickness of ds = 9 mm and the difference of these two phases.
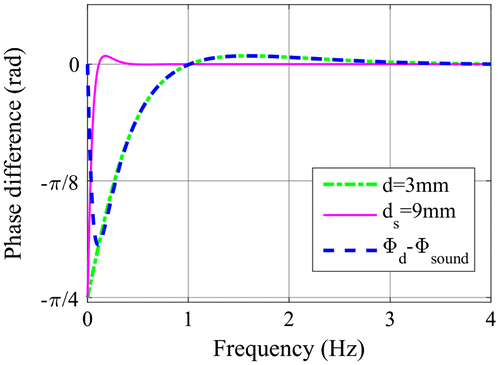
Figure 5. Phase of thermal waves for a defect depth of d = 3 mm, for a sound thickness of ds = 9 mm and the difference of these two phases.

Figure 6. a: FEM simulation model of bottom hole (d = 3 mm, ds = 9 mm, diameter D = 20 mm); b: temperature increase after instantaneous heating calculated for different defect sizes (d = 3 mm, ds = 9 mm).
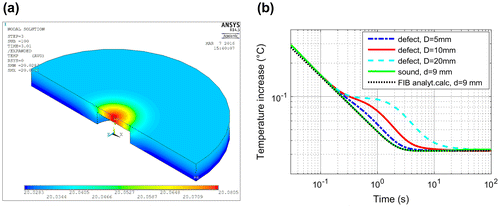
Figure 6. a: FEM simulation model of bottom hole (d = 3 mm, ds = 9 mm, diameter D = 20 mm); b: temperature increase after instantaneous heating calculated for different defect sizes (d = 3 mm, ds = 9 mm).

Figure 7. a: Phase calculated with FFT for the bottom hole defect FEM model; b: phase difference of both functions in Figure a compared with the phase difference of the thermal waves as shown in Figure .
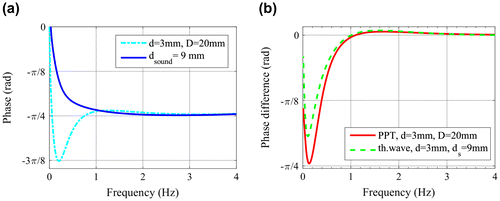
Figure 7. a: Phase calculated with FFT for the bottom hole defect FEM model; b: phase difference of both functions in Figure a compared with the phase difference of the thermal waves as shown in Figure 5.

Figure 8. Temperature (left), its 1st derivative (mid) and its 2nd derivative (right) for the simulation model with 20 mm diameter and 3 mm defect depth in a 9 mm thick sound steel material. As comparison also the analytically calculated functions for a finite body with 9 mm thickness are plotted.

Figure 8. Temperature (left), its 1st derivative (mid) and its 2nd derivative (right) for the simulation model with 20 mm diameter and 3 mm defect depth in a 9 mm thick sound steel material. As comparison also the analytically calculated functions for a finite body with 9 mm thickness are plotted.

Figure 9. 1st (a) and 2nd (b) derivative of temperature curves for models with different defect sizes (defect depth = 2 mm).
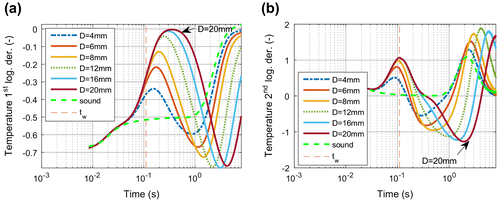
Figure 9. 1st (a) and 2nd (b) derivative of temperature curves for models with different defect sizes (defect depth = 2 mm).

Figure 10. a: Phase contrast calculated for the FEM simulation model of Figure (a) regarding different time durations; b: ratio of the calculated defect depth to the real depth plotted vs. tend.
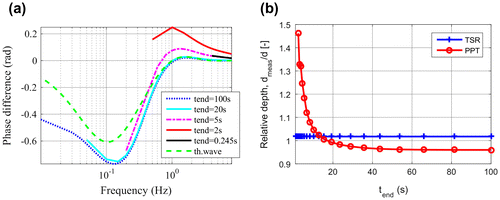
Figure 10. a: Phase contrast calculated for the FEM simulation model of Figure 6(a) regarding different time durations; b: ratio of the calculated defect depth to the real depth plotted vs. tend.

Figure 11. a: Ratio of the calculated defect depth to the real depth versus heating pulse length, defect depth = 1–3 mm, aspect ratio of defect diameter to depth is equal to 6 for all the simulated models; b: relative depth depending on the shifting of the starting time (D = 12 mm, d = 2 mm).

Figure 11. a: Ratio of the calculated defect depth to the real depth versus heating pulse length, defect depth = 1–3 mm, aspect ratio of defect diameter to depth is equal to 6 for all the simulated models; b: relative depth depending on the shifting of the starting time (D = 12 mm, d = 2 mm).

Figure 12. a: Phase contrast for different defect sizes, calculated for the same models as in Figure ; b: relative depth depending on the aspect ratio (d = 2 mm, D = 4–20 mm).
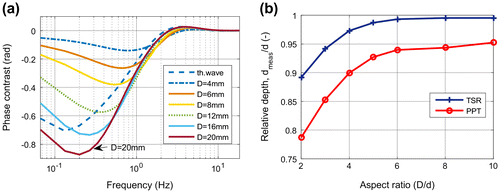
Figure 12. a: Phase contrast for different defect sizes, calculated for the same models as in Figure 8; b: relative depth depending on the aspect ratio (d = 2 mm, D = 4–20 mm).

Figure 13. Phase contrast in the vicinity of the zero crossing calculated with different sampling frequencies (d = 2 mm, D = 20 mm, tend = 100 s).
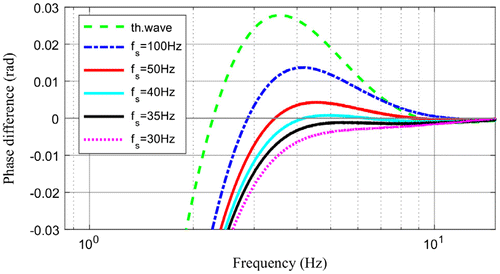
Figure 13. Phase contrast in the vicinity of the zero crossing calculated with different sampling frequencies (d = 2 mm, D = 20 mm, tend = 100 s).

Figure 14. a: Phase contrast with additional random noise (noise level = 0.005 °C); b: SNR of the phase contrast at the negative minimum (f = 0.13 Hz) and at the positive maximum (f = 1.67 Hz).
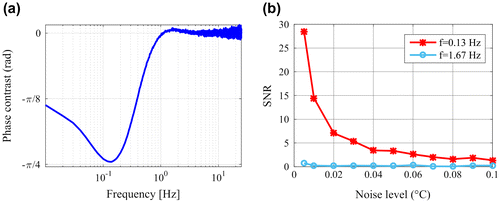
Figure 14. a: Phase contrast with additional random noise (noise level = 0.005 °C); b: SNR of the phase contrast at the negative minimum (f = 0.13 Hz) and at the positive maximum (f = 1.67 Hz).

Figure 15. Phase images for the simulated model with additional noise (noise level = 0.005 °C, D = 20 mm, d = 3 mm, ds = 9 mm, steel material parameters); a: at the frequency of the negative phase contrast minimum; b: at the zero crossing frequency; c: at the positive phase contrast maximum.
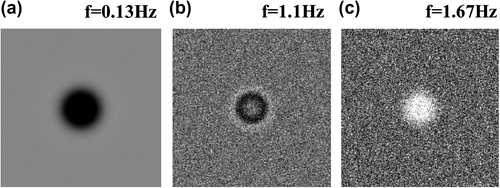
Figure 15. Phase images for the simulated model with additional noise (noise level = 0.005 °C, D = 20 mm, d = 3 mm, ds = 9 mm, steel material parameters); a: at the frequency of the negative phase contrast minimum; b: at the zero crossing frequency; c: at the positive phase contrast maximum.

Figure 16. 2nd derivative images at the maximum (a) and at the minimum (b), calculated for the same noisy model as in Figure .
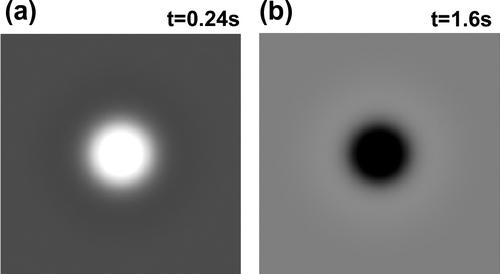
Figure 16. 2nd derivative images at the maximum (a) and at the minimum (b), calculated for the same noisy model as in Figure 15.

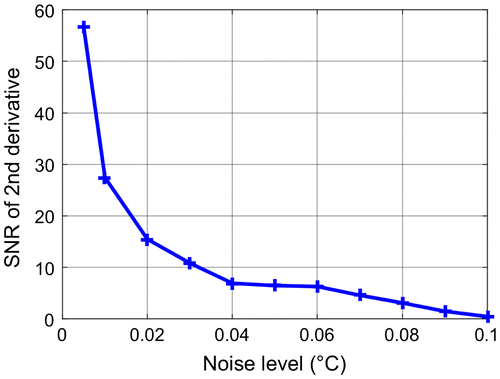
Figure 17. SNR of the 2nd derivative at tw = 0.24 s versus additional noise (d = 3 mm, D = 20 mm)

Figure 17. SNR of the 2nd derivative at tw = 0.24 s versus additional noise (d = 3 mm, D = 20 mm)

Figure 18. left: phase image at f = 0.1 Hz of three FBHs with 10 mm diameter and with remaining wall thickness d = 3,4,5 mm from top to bottom, respectively; mid: temperature vs. time function for these defects; right: phase contrast calculated by PPT for the same measurement.
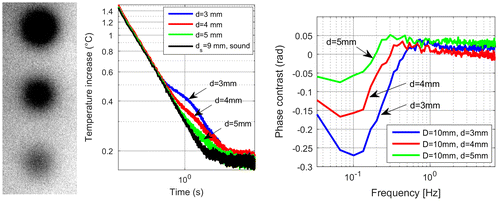
Figure 18. left: phase image at f = 0.1 Hz of three FBHs with 10 mm diameter and with remaining wall thickness d = 3,4,5 mm from top to bottom, respectively; mid: temperature vs. time function for these defects; right: phase contrast calculated by PPT for the same measurement.

Figure 19. a: Comparison of measured and simulated temperature curves (a) and their 2nd logarithmical derivatives (b) for two defects with a remaining wall thickness of 1 mm and defect diameter 12 and 8 mm.
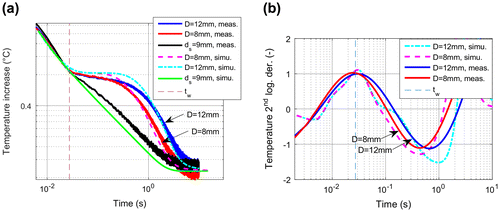
Figure 19. a: Comparison of measured and simulated temperature curves (a) and their 2nd logarithmical derivatives (b) for two defects with a remaining wall thickness of 1 mm and defect diameter 12 and 8 mm.

Figure 20. Comparison of phase contrast results based on the simulated (a) and measured (b) temperature for the same defects as in Figure .
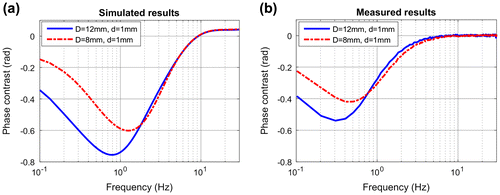
Figure 20. Comparison of phase contrast results based on the simulated (a) and measured (b) temperature for the same defects as in Figure 19.

Table 1. Comparison of PPT and TSR technique.