
Figures & data
Figure 1. Lifestyle and clinical variables correlated to faecal microbiota composition in the average Flemish population. (a) Multivariate model best explaining the faecal microbiota composition of the first 1106 participants [Citation24] of the Flemish Gut Flora Project (FGFP; dbRDA on genus-level Aitchison distance). The eleven variables significantly contributing to the model are listed from top to bottom until the AIC cut-off (dashed line), with their cumulative explanatory power in dark barplots (dbRDA R2). The total cumulative explanatory power of the best model sums to 4.8% (red stacked barplot). The variables’ individual explanatory power is also provided (lighter colour barplot). (b) Principal coordinate analysis depiction of FGFP faecal microbiota variation, with individuals coloured according to the samples’ enterotypes (DMM method), and arrows representing the effect size and direction of the three highest microbiome covariates in the FGFP: stool consistency (Bristol Stool Score), age, and gender.
![Figure 1. Lifestyle and clinical variables correlated to faecal microbiota composition in the average Flemish population. (a) Multivariate model best explaining the faecal microbiota composition of the first 1106 participants [Citation24] of the Flemish Gut Flora Project (FGFP; dbRDA on genus-level Aitchison distance). The eleven variables significantly contributing to the model are listed from top to bottom until the AIC cut-off (dashed line), with their cumulative explanatory power in dark barplots (dbRDA R2). The total cumulative explanatory power of the best model sums to 4.8% (red stacked barplot). The variables’ individual explanatory power is also provided (lighter colour barplot). (b) Principal coordinate analysis depiction of FGFP faecal microbiota variation, with individuals coloured according to the samples’ enterotypes (DMM method), and arrows representing the effect size and direction of the three highest microbiome covariates in the FGFP: stool consistency (Bristol Stool Score), age, and gender.](/cms/asset/49fd15fb-3e9f-4386-8bb9-fcff29f2de6d/yacb_a_1583782_f0001_oc.jpg)
Figure 2. Transit time is at the intersection of human health, lifestyle, and gastrointestinal microbiota. Transit time, and its proxy stool consistency, can be shaped by disease and medication, diet and physical activity, and microbial metabolism. Reciprocally, transit time is a key parameter reflecting the maturation of the colon ecosystem in healthy individuals, along which water is reabsorbed and nutrients are depleted, leading to rearrangements in microbial metabolism and the fitness of different microbiota fractions.
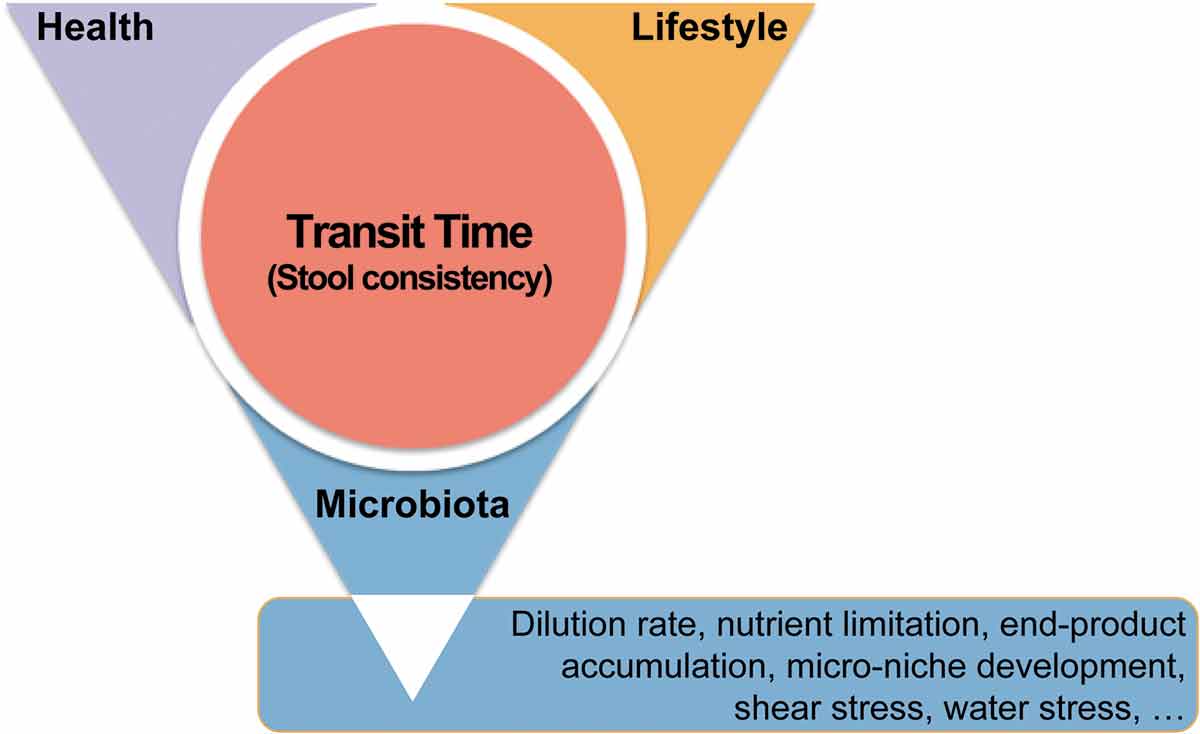
Figure 3. Comparison of faecal microbiota relative and quantitative microbiota profiling. The middle panel depicts the relative faecal microbiota profiles (RMP) of 40 healthy individuals [Citation37], while the right panel depicts the corresponding quantitative microbiota profiles (QMP), as obtained by combining 16S RNA amplicon sequencing with total microbial load quantification by flow cytometry. Substantial differences in microbial cell density in faecal samples translate in uneven sampling depth after equimolar pooling and sequencing in RMP protocols (left panel), with oversampling of low microbial load samples.
![Figure 3. Comparison of faecal microbiota relative and quantitative microbiota profiling. The middle panel depicts the relative faecal microbiota profiles (RMP) of 40 healthy individuals [Citation37], while the right panel depicts the corresponding quantitative microbiota profiles (QMP), as obtained by combining 16S RNA amplicon sequencing with total microbial load quantification by flow cytometry. Substantial differences in microbial cell density in faecal samples translate in uneven sampling depth after equimolar pooling and sequencing in RMP protocols (left panel), with oversampling of low microbial load samples.](/cms/asset/1c8e57a6-d9eb-43ad-bbad-09395fc77faf/yacb_a_1583782_f0003_oc.jpg)