
Figures & data
Figure 1. KOF Globalization Index (0–100) in the GCC countries between 1975 and 2016. ARE stands for United Arab Emirates; BHR for Bahrain; KWT for Kuwait; OMN for Oman; QAT for Qatar; and SAU for Saudi Arabia. Source: Authors' own compilation based on raw data from KOF Swiss Economic Institute.
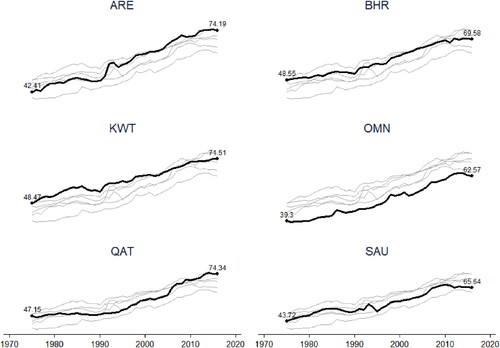
Figure 2. Obesity rates across select regions between 1975 and 2016. The EU includes all 28 EU countries as of 2016. The MENA does not include the GCC countries. South America includes only countries on continental South America and does not include the Caribbean island nations. North America includes the USA, Canada, and Mexico. South-East Asia includes countries in South-East and East Asia. Authors' own compilation based on raw data from the WHO.
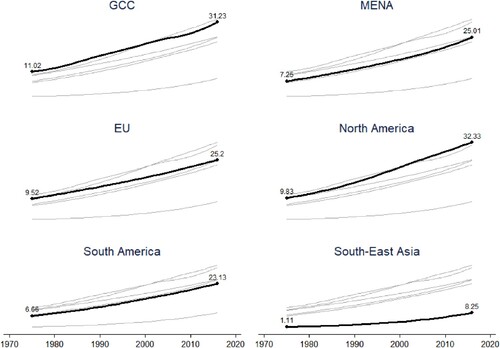
Table 1. Data sources.
Table 2. Descriptive statistics of all variables used.
Figure 3. GCC food imports (millions USD) of healthy and unhealthy foods. Products are classified as unhealthy based on the USDA classification of unhealthy foods. A list of healthy and healthy products is provided in (Appendix 2). Source: Authors’ own compilation.
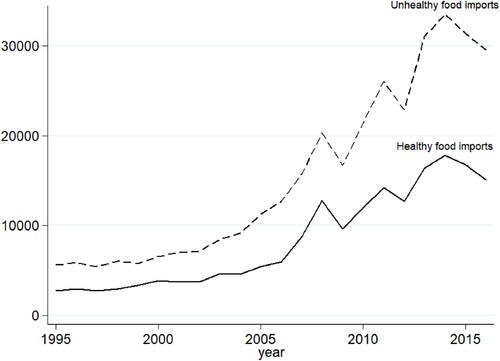
Table 3. Benchmark results from estimating equation (1) using the Arellano and Bond GMM estimator.
Figure A1. KOF Social Globalization Index (0–100) in the GCC countries between 1975 and 2016. ARE stands for United Arab Emirates; BHR for Bahrain; KWT for Kuwait; OMN for Oman; QAT for Qatar; and SAU for Saudi Arabia. Source: Authors’ own compilation based on raw data from KOF Swiss Economic Institute.
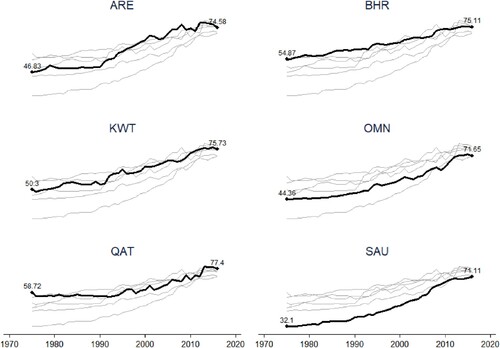
Figure A2. KOF Economic Globalization Index (0–100) in the GCC countries between 1975 and 2016. ARE stands for United Arab Emirate; BHR for Bahrain; KWT for Kuwait; OMN for Oman; QAT for Qatar; and SAU for Saudi Arabia. Source: Authors’ own compilation based on raw data from KOF Swiss Economic Institute.
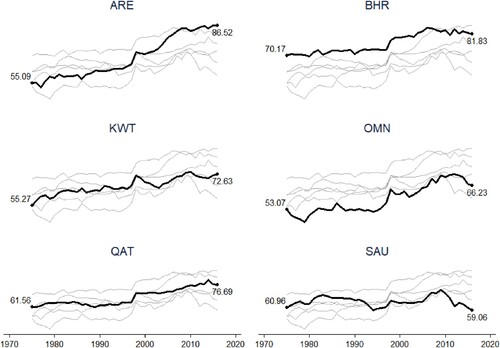
Figure A3. Obesity rates (percentages of populations) in the GCC countries between 1975 and 2016. ARE stands for United Arab Emirate; BHR for Bahrain; KWT for Kuwait; OMN for Oman; QAT for Qatar; and SAU for Saudi Arabia. Source: Authors’ own compilation based on raw data from the WHO.
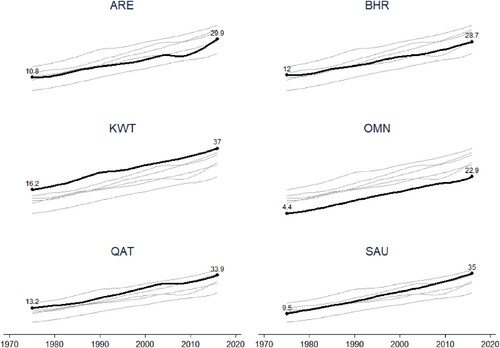
Figure A4. Food imports, population, and GDP per capita indices in the GCC countries between 1995 (= 100) and 2016. Authors’ own compilation based on raw data from the World Bank.
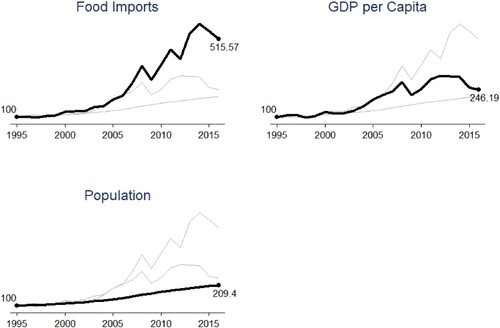
Figure A5. Food imports in the GCC countries from various sources between 1995 and 2016. Authors’ own compilation based on trade data from CEPII (BACI).
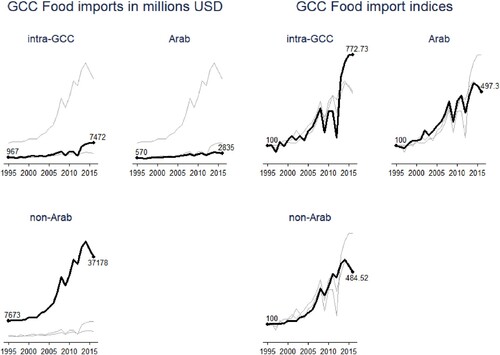
Figure A6. Indices of the top eight products (HS-2 digit) imported into the GCC between 1995 (= 100) and 2016. Authors’ own compilation.
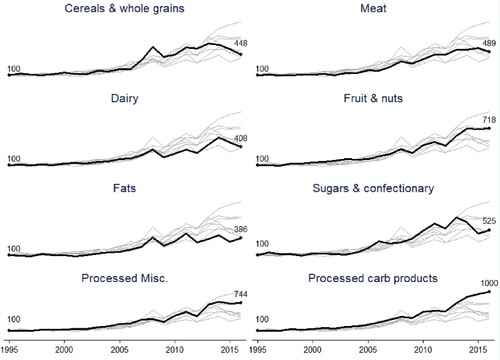
Table A1. List of countries in the sample.
Table A2. List of HS-2 products classified as healthy or unhealthy.
Table A3. Coefficients of correlation of the underlying globalization indices.
Table A4. Robustness checks.
Data availability statement
The ‘obesity’ data that support the findings of this study are available from the World Health Organization (WHO) (https://www.who.int/news-room/fact-sheets/detail/obesity-and-overweight). The ‘KOF Globalization Index’ data are available from ‘KOF Swiss Economic Institute’ (https://kof.ethz.ch/en/forecasts-and-indicators/indicators/kof-globalisation-index.html#). Data on ‘Human Development Index’ (HDI) are available from the ‘United Nations Development Programme’ (http://hdr.undp.org/en/data). Other data used in the paper are available from the ‘World Bank’ (https://databank.worldbank.org/source/world-development-indicators).