Figures & data
Figure 1. A representation of algebra tiles
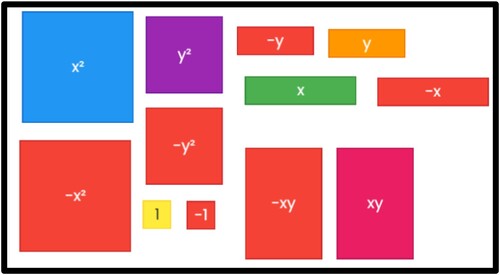
Figure 2. The manipulation of algebra tiles (Hall, Citation1999)
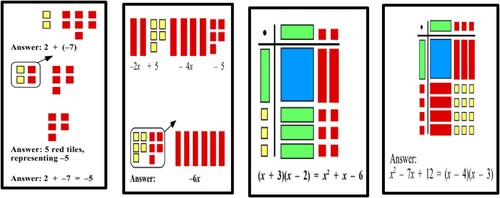
Table 1. Categorisation and description of errors (adapted from Ncube, Citation2016)
Table 2. Intervention lessons
Figure 3. Learners’ performance on each test
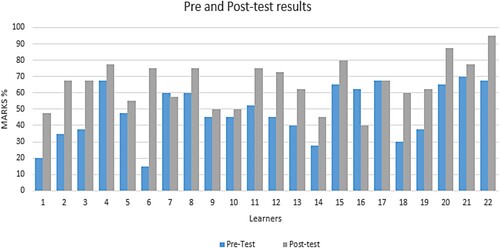
Table 3. The average overall performance on the pre- and post-tests
Table 4. A summary of the results from both the pre- and post-tests that demonstrate learner achievement
Table 5. The dependent sample test results
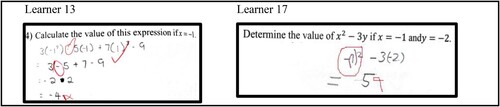
Figure 4. Learners’ common errors on the tests
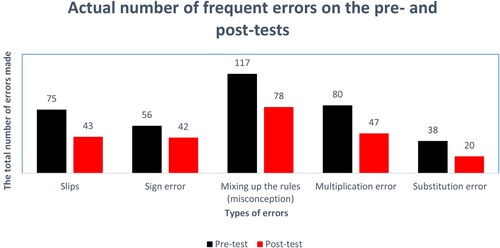
Figure 5. Some common slips on the tests
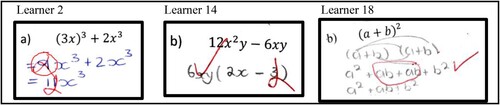
Table 6. The average percentage decrease between the pre- and post-tests for common errors
Figure 6. A representation of addition and subtraction of like terms using the algebra tiles
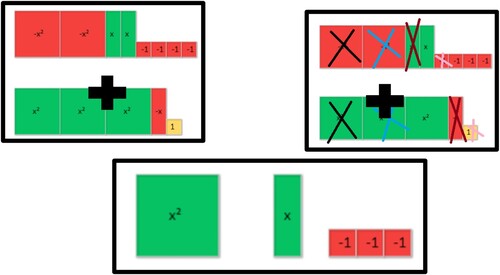
Figure 7. Some sign errors that were recorded
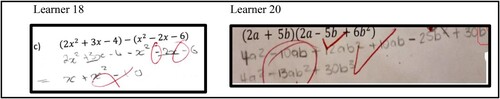
Figure 8. Squaring a binomial using algebra tiles:
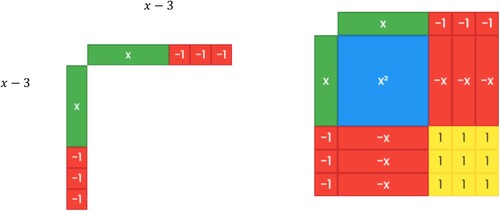
Figure 9. Typical misconceptions that were encountered on the pre-tests
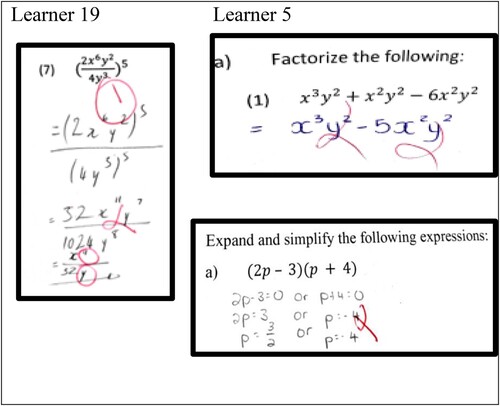
Figure 10. Some of the most common multiplication errors discovered on the tests
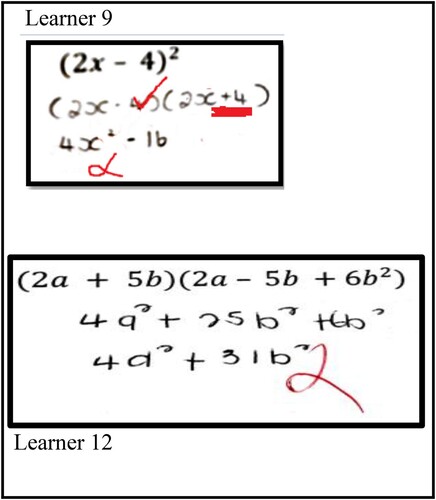
Figure 11. Substitution using algebra tiles:
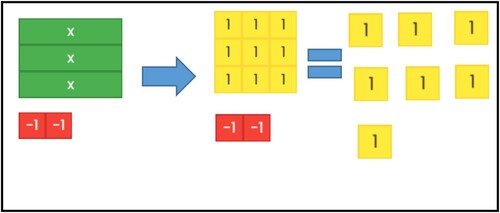
Figure 12. Example of substitution errors observed on the pre-tests