
Figures & data
Table 1. Characteristics of the MO and IF breeds in the present study (means ± SD).
Table 2. Body condition score, milk yield and milk composition in MO and IF cows.
Table 3. Milk coagulation properties in MO and IF cows.
Table 4. Milk dry matter, ash, mineral concentration and micellar content of Ca, P and Mg in MO and IF cows.
Figure 1. Estimated simple linear regression between (a) milk total P (mg/100 g milk) and (b) milk protein or casein (g/100 g milk) at 21 weeks post-calving in MO and IF cows.
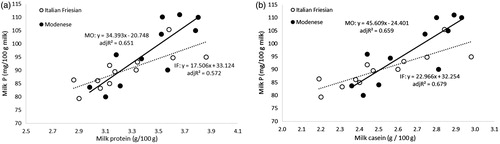
Table 5. Pearson (above the diagonal) and partial (under the diagonal) correlations among milk parameters considering data from MO and IF cows from T8 plus T21.
Table 6. Rotated factor pattern and variable communality.