Figures & data
Table 1. Sample information used in present study.
Figure 1. Relative expression levels of white blood cell (WBC) count (A) and red blood cell (RBC) count (B) in four chicken populations. Data are shown as the mean ± SE from six independent experiments. The bars without the same letter indicate differences significant at p < .05. TC: Tibetan chicken; LTC: Tibetan chicken reared at low altitude; LC: Peng County yellow chicken; HLC: Baoxing native chicken reared at high altitude.
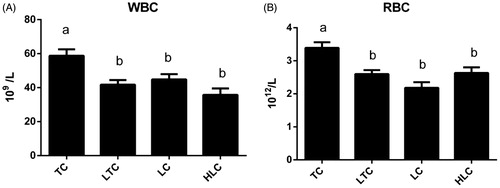
Figure 2. Relative expression levels of haemoglobin (HGB) (A), mean corpuscular haemoglobin (MCH) (B) and MCH concentration (MCHC) (C) in four chicken populations. Data are shown as the mean ± SE from six independent experiments. The bars without the same letter indicate differences significant at p < .05. TC: Tibetan chicken; LTC: Tibetan chicken reared at low altitude; LC: Peng County yellow chicken; HLC: Baoxing native chicken reared at high altitude.
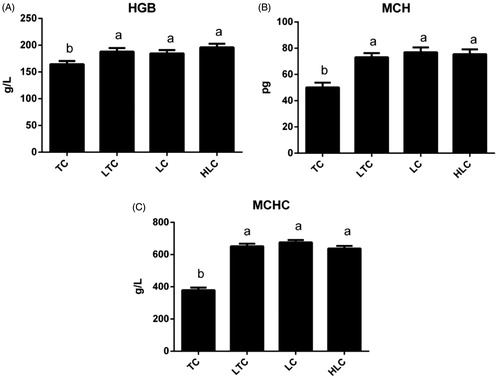
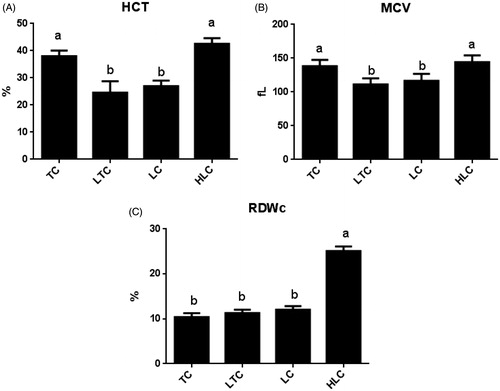
Figure 3. Relative expression levels of haematocrit (HCT) (A), mean cell volume (MCV) (B) and variable coefficient of red cell distribution width (RDWc) (C) in four chicken populations. Data are shown as the mean ± SE from six independent experiments. The bars without the same letter indicate differences significant at p < .05. TC: Tibetan chicken; LTC: Tibetan chicken reared at low altitude; LC: Peng County yellow chicken; HLC: Baoxing native chicken reared at high altitude.