
Figures & data
Figure 1(a–c). Change in milk yield, milk fat/protein ratio and milk somatic cell count (as log10 cells/mL) throughout lactation by month of kidding (LS means) for goats which kidded in season (goats = 5559).
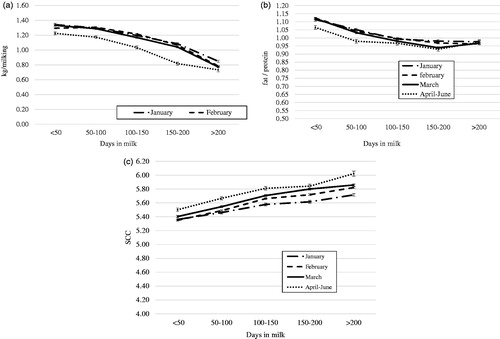
Table 1. Description of the 173 dairy goat farms: main characteristics (percentage of farms).
Table 2. Description of the 173 dairy goat farms: milking facilities and routine (percentage of farms).
Table 3. Average herd traits, milk production and quality of the sample of 91 farms (6981 goats; individual and bulk tank milk controls).
Table 4. Logistic analysis of risk factors associated to the presence of more than 50% of lactating goats with milk fat/protein reversion.
Table 5. Logistic analysis of risk factors associated to the presence of more than 50% of lactating goats with SCCTable Footnote* > 5.8 log10 cell/mL.
Table 6. Regression model for milk yield, milk fat and milk protein percentages.