Figures & data
Table 1. Protein spots showing differences in protein abundance in F1M1 vs F2M1 milk samples comparison identified by LC-MS/MS. For a full definition of milk samples, see “Sample collection and processing”.
Table 2. Protein spots showing differences in protein abundance for M1/M2 and M1/M3 milk samples comparisons identified by LC-MS/MS. For a full definition of milk samples, see “Protein pools preparation and labelling”.
Figure 1. SDS-PAGE analysis of whole milk samples. Lanes from 2 to 7 =F2M1, F2M2, F2M3, F1M1, F1M2, F1M3; molecular weight marker = lanes 1. SDS-PAGE: sodium dodecyl sulfate-polyacrylamide gel electrophoresis. For a full definition of milk samples, see “Sample collection and processing”.
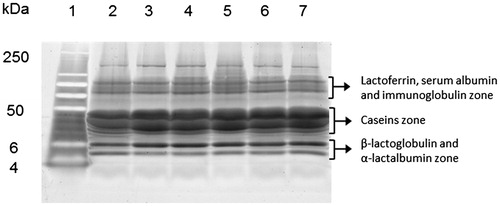
Figure 2. 2D-map of whole milk pooled sample (obtained with all milk samples F1M1+F1M2+F1M3+F2M1+F2M2+F2M3) of Girgentana goat with Coomassie Blue R-250 (A) and SYPRO® Ruby (B) staining. For a full definition of milk samples, see “Sample collection and processing”.
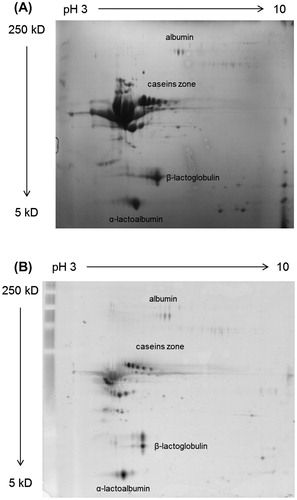
Figure 3. Differential abundant protein spots identified by LC-MS/MS in F1M1 vs F2M1 milk samples comparison (207 = β-lactoglobulin, 381, 395 and 414 = κ-casein; 939 = β-casein; 982 = αS1-casein). LC-MS/MS: liquid chromatography/mass spectrometry. For a full definition of milk samples, see “Sample collection and processing”.
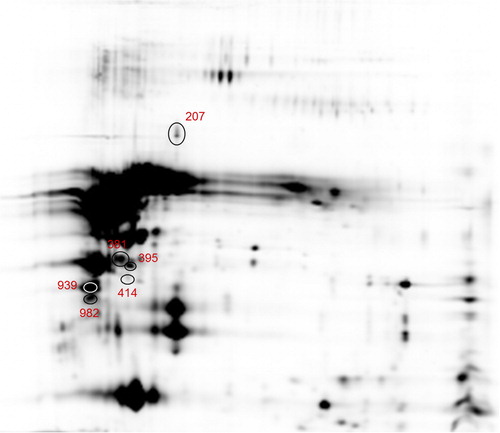
Figure 4. Differential abundant protein spots identified by LC-MS/MS in M1 vs M2, M1 vs M3, and M2 vs M3 milk samples comparisons (17 = MFG EGF-factor 8; 183, 426 and 737 = β-casein; 282 = β-lactoglobulin). For a full definition of milk samples, see “Protein pools preparation and labelling”. LC-MS/MS: liquid chromatography/mass spectrometry. MFG EGF-factor 8: Milk fat globule epidermal growth-factor 8.
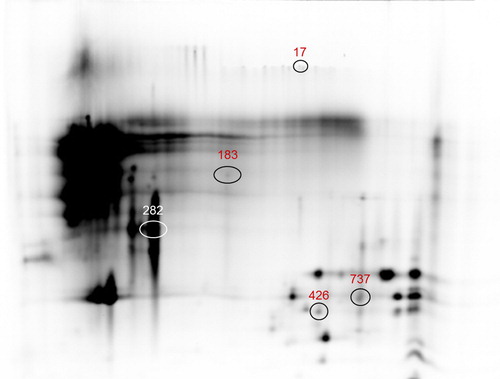
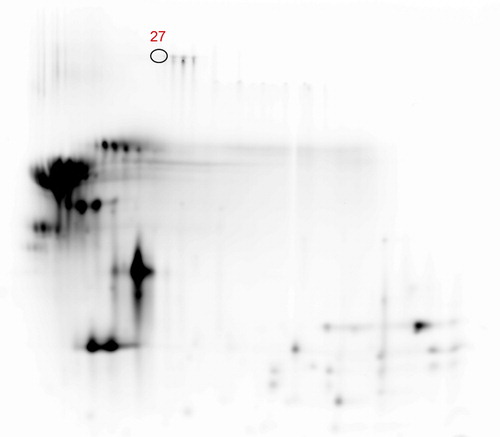
Figure 5. Differential abundant protein spot identified by LC-MS/MS in F1 vs F2 comparison. (27 = serum albumin). LC-MS/MS: liquid chromatography/mass spectrometry. For a full definition of milk samples, see “Protein pools preparation and labelling”.