Figures & data
Figure 1. Proportional distribution of visual scores of conformation (CS), finishing precocity (FP), muscling (MS), and size (SS) in 13,105 Nellore females.
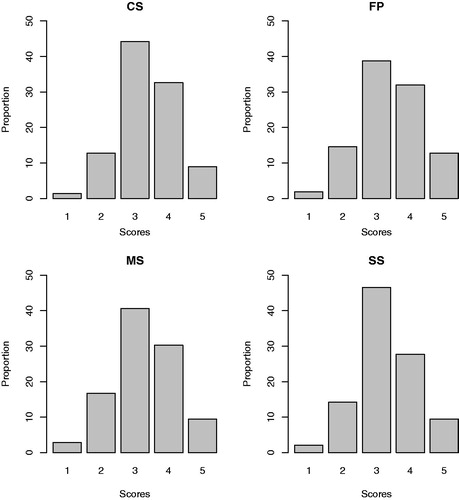
Table 1. Descriptive statistics for the traits used in both principal component and factor analysis.
Table 2. Eigenvalues (), variance percentage (VP), and cumulative variance percentage (CVP) explained by principal components.
Table 3. Correlation coeficients between traits with the three first principal components.
Figure 2. Distribution of the precocious (1) and non-precocious (0) dams, and of the traits: weight gain from birth to weaning (WWG), weight gain from weaning to yearling (YWG), backfat thickness at yearling (BFT), age at first calving (AFC), days to second calving (DSC), cumulative productivity (CP), and longevity (LONG), considering the first two principal components (PC1 and PC2).
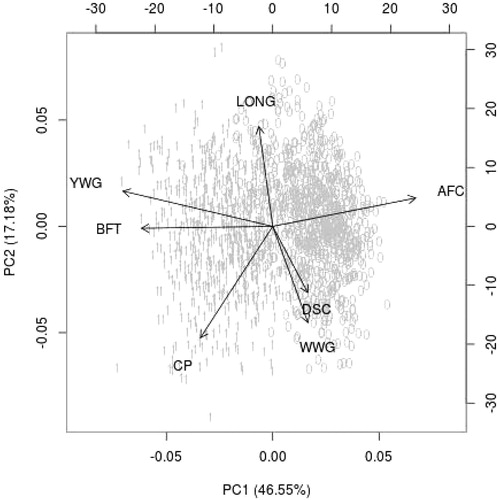
Table 4. Factors after rotation and its corresponding values.
Table 5. Mean of the precocious (P) and non-precocious (NP) dams for the scores in each factor and for the growth, reproduction, and production traits.
Figure 3. Distribution of the precocious dams (1) and non-precocious (0), and of the traits: weight gain from birth to weaning (WWG), weight gain from weaning to yearling (YWG), backfat thickness at yearling (BFT), age at first calving (AFC), days to second calving (DSC), cumulative productivity (CP), and longevity (LONG), considering the first and the third principal components (PC1 and PC3).
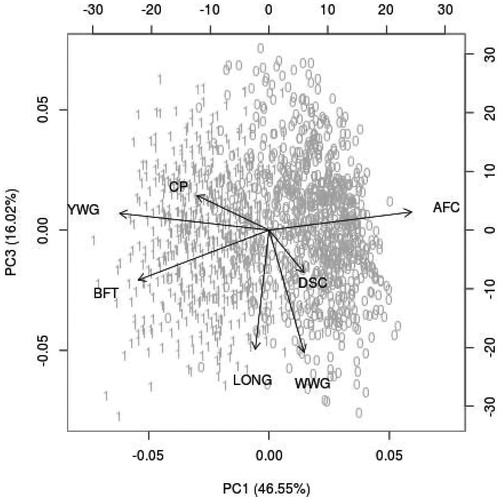
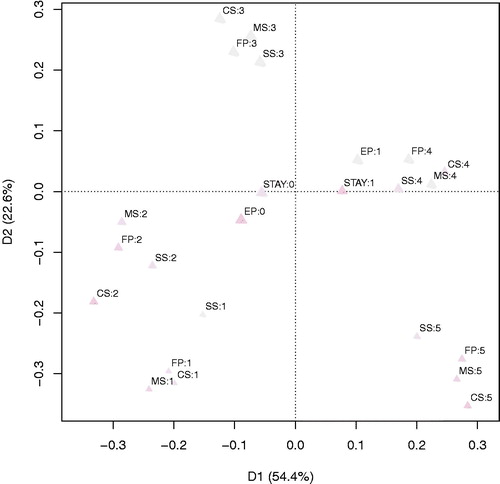
Figure 4. Perceptual map, dimensions 1 and 2 (D1 and D2) and their respective inertia for the traits: early pregnancy (EP), stayability (STAY), success (1), and failure (0) scores, measured at yearling and ranging from 1 to 5, of conformation (CS), finishing precocity (FP), muscling (MS), and size (SS).