
Figures & data
Table 1. The average WGs and DWGs, FIs and RFIs of the local and commercial chickens.
Table 2. The number of RNA-Seq reads and mapping rates of the two breeds.
Figure 1. The volcano plot for the differentially expressed genes. Right upper dots denotes the up-regulated genes in the native breed; left upper dots denotes the up-regulated genes in the commercial breed; lower dots denotes the genes with no significant changes.
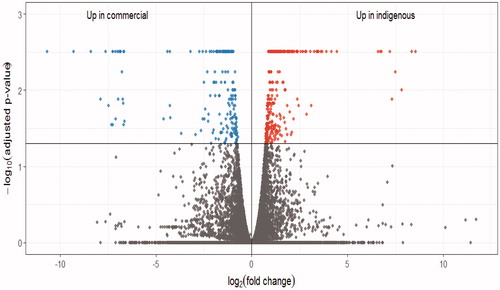
Table 3. Top 10 known up- and down-regulated genes in the local breed.
Figure 2. A circus plot showing the chromosomal distribution of the known and novel differentially expressed genes. Each circle from the periphery to the centre represents the following specifications: chromosomal location, the positions of the known genes in the genome, log2-fold change of the commercial to the native breed for the known genes, log2-fold change of the commercial to the native breed for the novel genes and their positions in the genome.
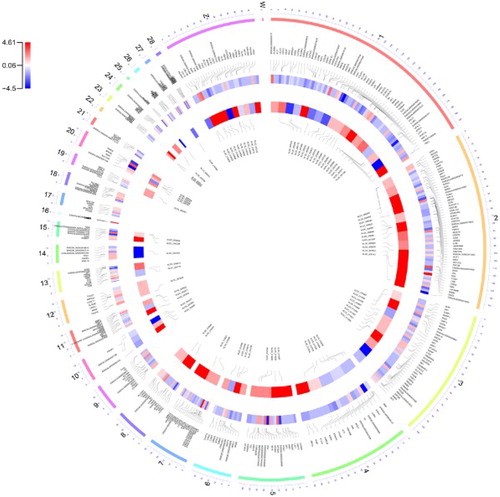
Figure 3. Validation of the differentially expressed genes in the liver tissues of the native and commercial chickens. qRT-PCR: Quantitative Real time Polymerase chain reaction; RNA-Seq: RNA Sequencing.
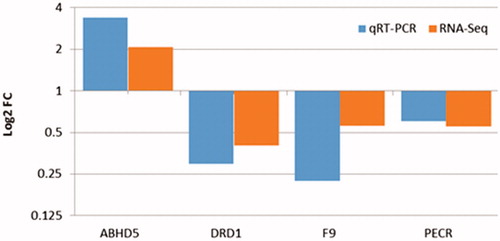
Table 4. Significantly enriched GO terms for the down-regulated genes in the local breed.
Table 5. List of the down-regulated genes in the local breed, which were localised in more than one QTL based on feed efficiency.