
Figures & data
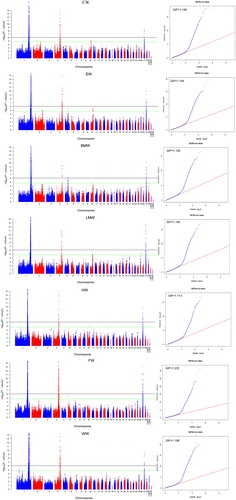
Figure 1. Manhattan plot (left) and quantile–quantile (QQ) plot (right) of the observed p values for carcase traits. In the Manhattan plots, –log10 (observed p values) of the SNPs were plotted against their genomic positions, the black lines depict the genome-wide significant (8.43 × 10⁻⁷) threshold. For the QQ plot, the x-axis indicates the expected –log10-transformed p values, and the y-axis shows the observed –log10-transformed p values. The genomic inflation factors (λ) are shown on the top left in the QQ plots.
Supplemental material