
Figures & data
Table 1. Description of the database.
Table 2. Estimated parameters (mean ± SE) from different non-linear models, root mean square error (RMSE), Bayesian information criterion (BIC) and Akaike information criterion (AIC).
Table 3. Estimated parameters (mean ± SE) from different linear models, root mean square error (RMSE), Bayesian information criterion (BIC) and Akaike information criterion (AIC).
Figure 1. Trajectory of lactation curves estimated by 305-day milk yield from database (TMY), Wood’s linear model (WDlin), Ali and Schaeffer’s model (ASH), Wood’s non-linear model (WDnlin) and Wilmink’s (WL) model for 1/2H (A), 1/4H (B), 3/4H (C), 3/8H (D), 5/8H (E), 7/8 (F), G (G) and H (H) genetic groups.
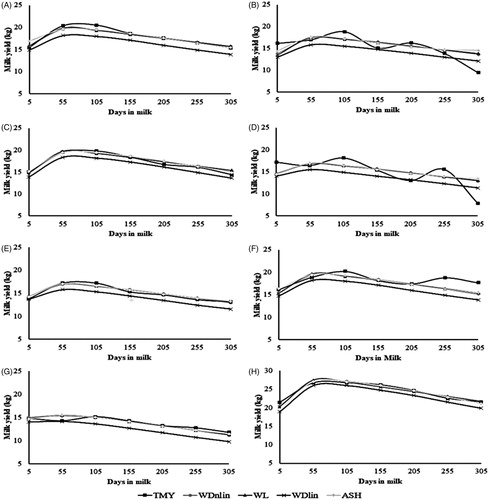
Table 4. Average estimates of peak yield (PY), peak time (PT), persistency (P, P2:1; P3:1, and P3:2) and 305-day milk yield (TMY) for different genetic groups estimated by linear and non-linear models.
Table 5. Heterosis effect (mean ± SE) for Wood parameters (a, b and c), peak yield (PY), peak time (PT), persistency measures (P, P2:1, P3:1, and P3:2) and 305-day milk yield (TMY) estimated by Wood’s non-linear model.