Figures & data
Table 1. Number and Q Value of RNA-seq Reads.
Table 2. Mapping results of RNA-seq reads.
Figure 1. Number of DEGs between LW and MS pigs. (a) Number of genes between LW and MS pigs; (b) Number of DEGs under different FC; (c) Scatter plot for DEGs and p-value volcano plot. The points below of the “---” denotes genes with no significant changes; The points on the left of the “|” denotes up-regulated genes; The points on the right of the “|” denotes down-regulated genes.LW: Large White; MS: Mashen; FC: Fold Change.
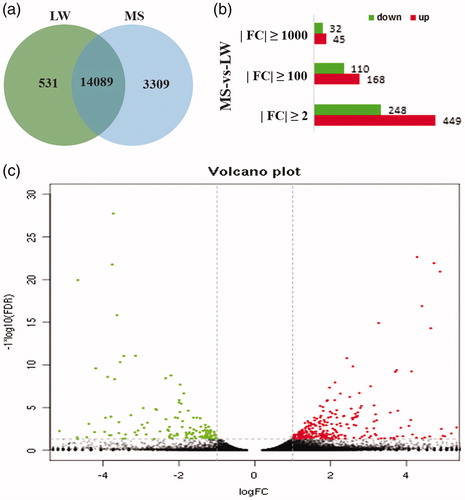
Figure 2. GO analysis of DEGs. LW: Large White; MS: Mashen; GO: Gene Ontology; DEGs: difference expression genes.
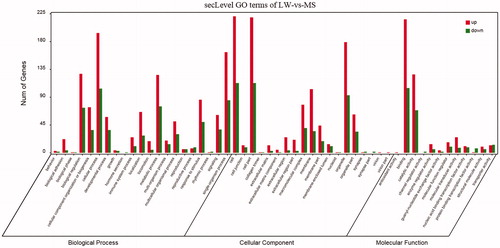
Figure 3. KEGG pathway analysis of DEGs. KEGG: Kyoto Encyclopedia of Genes and Genomes; DEGs: difference expression genes.
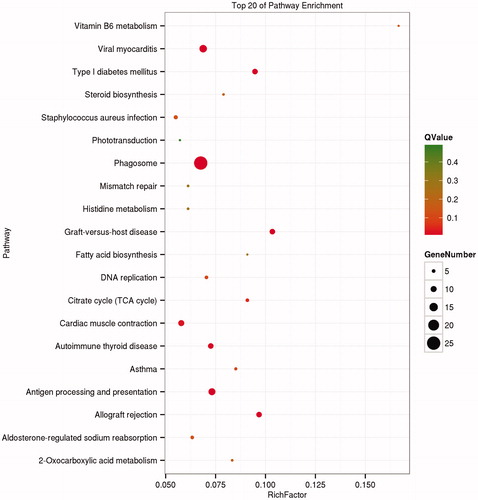
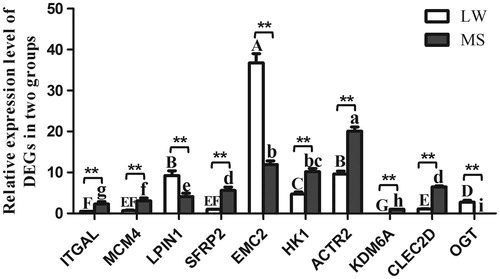
Figure 4. The expression level of DEGs validated by qPCR. Large White pig (LW), Mashen pig (MS). Values in the bar diagram indicate ‘mean ± standard errors’. In the same breed, means with no common letter differ significantly. In the same tissue, ‘*’ indicates that the difference between LW and MS had a significance level of .05 level, ‘**’ indicates that the difference between LW and MS had a significance level of 0.01. LW: Large White; MS: Mashen.