
Figures & data
Table 1. Body characteristics of the most common sheep breeds in the world.
Figure 1. Forest plot diagram of the effect on the characteristics on the slaughter in carcase lambs fed with and without supplement. The x-axis shows the difference of standardised means (standardised by the z-statistic); therefore, the points to the left of the line represent a reduction in the trait, while the points to the right of the line indicate an increase. Each square represents the size of the mean effect of that study, and the size of the square reflects the relative weight of the study of the overall estimate of effect size with the larger squares representing a larger weight. The upper and lower bound of the squared line represents the upper and lower confidence intervals of 95% for the size of the effect. The diamond at the bottom represents the 95% confidence interval for the global estimate, and the vertical line of points represents the mean difference of zero or no effect.
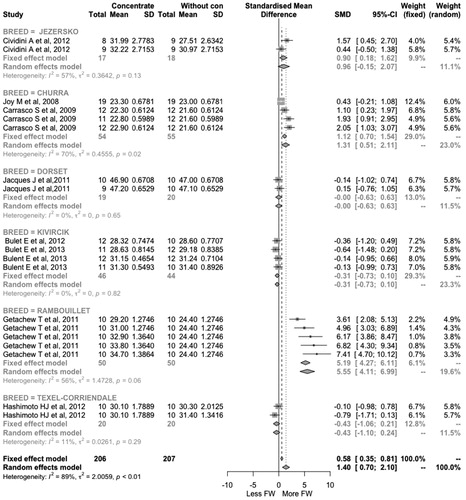
Figure 2. Forest plot diagram of the effect on the hot carcase weight (HCW) in lambs fed with and without supplement. The x-axis shows the difference of standardised means (standardised by the z-statistic); therefore, the points to the left of the line represent a reduction in the trait, while the points to the right of the line indicate an increase. Each square represents the size of the mean effect of that study, and the size of the square reflects the relative weight of the study of the overall estimate of effect size with the larger squares representing a larger weight. The upper and lower bound of the squared line represents the upper and lower confidence intervals of 95% for the size of the effect. The diamond at the bottom represents the 95% confidence interval for the global estimate, and the vertical line of points represents the mean difference of zero or no effect.
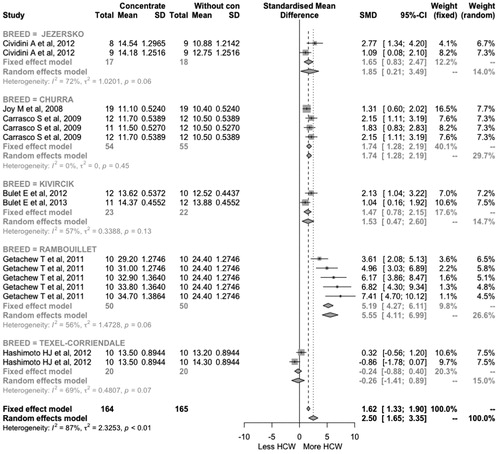
Figure 3. Forest plot diagram of the effect on the cold carcase weight (CCW) in lambs fed with and without supplement. The x-axis shows the difference of standardised means (standardised by the z-statistic); therefore, the points to the left of the line represent a reduction in the trait, while the points to the right of the line indicate an increase. Each square represents the size of the mean effect of that study, and the size of the square reflects the relative weight of the study of the overall estimate of effect size with the larger squares representing a larger weight. The upper and lower bound of the square line represents the upper and lower confidence intervals of 95% for the size of the effect. The diamond at the bottom represents the 95% confidence interval for the global estimate, and the vertical line of points represents the mean difference of zero or no effect.
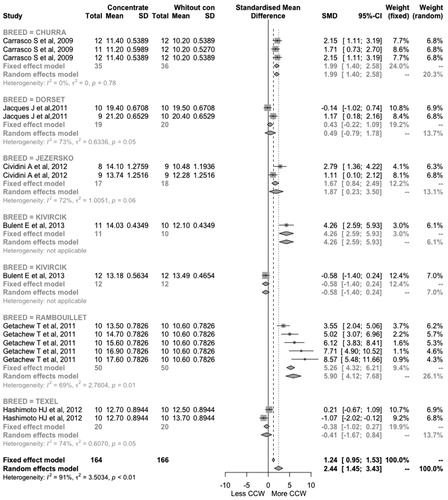
Figure 4. Forest plot diagram of the effect on the area of longissimus dorsi (ALd) in lambs fed with and without supplement. The x-axis shows the difference of standardised means (standardised by the z-statistic); therefore, the points to the left of the line represent a reduction in the trait, while the points to the right of the line indicate an increase. Each square represents the size of the mean effect of that study, and the size of the square reflects the relative weight of the study of the overall estimate of effect size with the larger squares representing a larger weight. The upper and lower bound of the square line represents the upper and lower confidence intervals of 95% for the size of the effect. The diamond at the bottom represents the 95% confidence interval for the global estimate, and the vertical line of points represents the mean difference of zero or no effect.
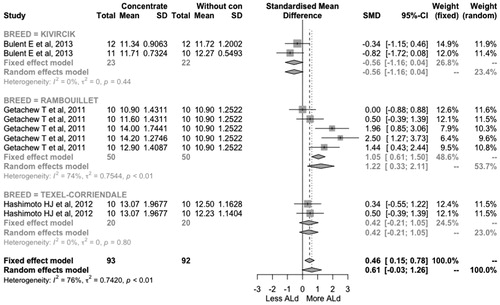
Figure 5. Forest plot diagram of the effect on the subcutaneous fat thickness lambs fed with and without supplement. The x-axis shows the difference of standardised means (standardised by the z-statistic); therefore, the points to the left of the line represent a reduction in the trait, while the points to the right of the line indicate an increase. Each square represents the size of the mean effect of that study, and the size of the square reflects the relative weight of the study of the overall estimate of effect size with the larger squares representing a larger weight. The upper and lower bound of the squared line represents the upper and lower confidence intervals of 95% for the size of the effect. The diamond at the bottom represents the 95% confidence interval for the global estimate, and the vertical line of points represents the mean difference of zero or no effect.
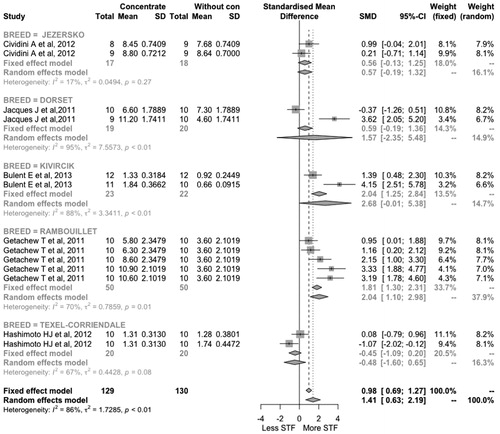
Figure 6. Forest plot diagram of the effect on the final body weight (FBW) (kg) in lambs fed in Feed-Lot or Free Range systems. The x-axis shows the difference of standardised means (standardised by the z-statistic); therefore, the points to the left of the line represent a reduction in the trait, while the points to the right of the line indicate an increase. Each square represents the size of the mean effect of that study, and the size of the square reflects the relative weight of the study of the overall estimate of effect size with the larger squares representing a larger weight. The upper and lower bound of the square line represents the upper and lower confidence intervals of 95% for the size of the effect. The diamond at the bottom represents the 95% confidence interval for the global estimate, and the vertical line of points represents the mean difference of zero or no effect.
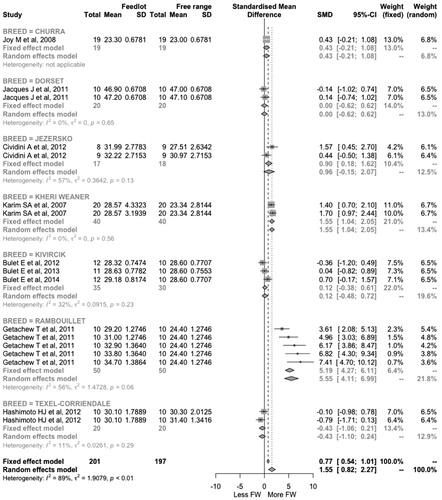
Figure 7. Forest plot diagram of the effect on the hot carcase weight (HCW) in lambs fed in Feed-Lot or Free Range systems. The x-axis shows the difference of standardised means (standardised by the z-statistic); therefore, the points to the left of the line represent a reduction in the trait, while the points to the right of the line indicate an increase. Each square represents the size of the mean effect of that study, and the size of the square reflects the relative weight of the study of the overall estimate of effect size with the larger squares representing a larger weight. The upper and lower bound of the square line represents the upper and lower confidence intervals of 95% for the size of the effect. The diamond at the bottom represents the 95% confidence interval for the global estimate, and the vertical line of points represents the mean difference of zero or no effect.
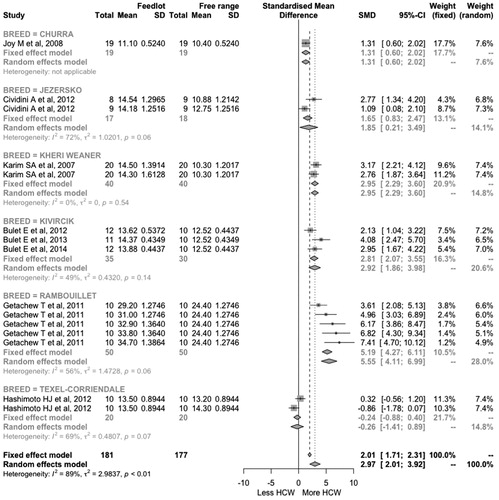
Figure 8. Forest plot diagram of the effect on the cold carcase weight (CCW) in lambs fed in Feed-Lot or Free Range systems. The x-axis shows the difference of standardised means (standardised by the z-statistic); therefore, the points to the left of the line represent a reduction in the trait, while the points to the right of the line indicate an increase. Each square represents the size of the mean effect of that study, and the size of the square reflects the relative weight of the study of the overall estimate of effect size with the larger squares representing a larger weight. The upper and lower bound of the square line represents the upper and lower confidence intervals of 95% for the size of the effect. The diamond at the bottom represents the 95% confidence interval for the global estimate, and the vertical line of points represents the mean difference of zero or no effect.
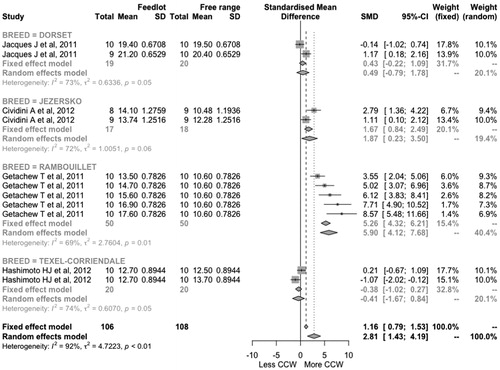
Figure 9. Forest plot diagram of the effect on the area of the longissimus dorsi in lambs fed in Feed-Lot or Free Range systems. The x-axis shows the difference of standardised means (standardised by the z-statistic); therefore, the points to the left of the line represent a reduction in the trait, while the points to the right of the line indicate an increase. Each square represents the size of the mean effect of that study, and the size of the square reflects the relative weight of the study of the overall estimate of effect size with the larger squares representing a larger weight. The upper and lower bound of the squared line represents the upper and lower confidence intervals of 95% for the size of the effect. The diamond at the bottom represents the 95% confidence interval for the global estimate, and the vertical line of points represents the mean difference of zero or no effect.
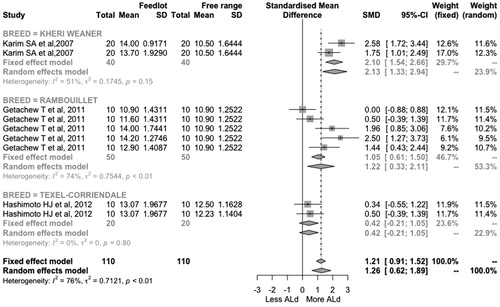
Figure 10. Forest plot diagram of the effect on the subcutaneous fat thickness in lambs fed in Feed-Lot or Free Range systems. The x-axis shows the difference of standardised means (standardised by the z-statistic); therefore, the points to the left of the line represent a reduction in the trait, while the points to the right of the line indicate an increase. Each square represents the size of the mean effect of that study, and the size of the square reflects the relative weight of the study of the overall estimate of effect size with the larger squares representing a larger weight. The upper and lower bound of the square line represents the upper and lower confidence intervals of 95% for the size of the effect. The diamond at the bottom represents the 95% confidence interval for the global estimate, and the vertical line of points represents the mean difference of zero or no effect.
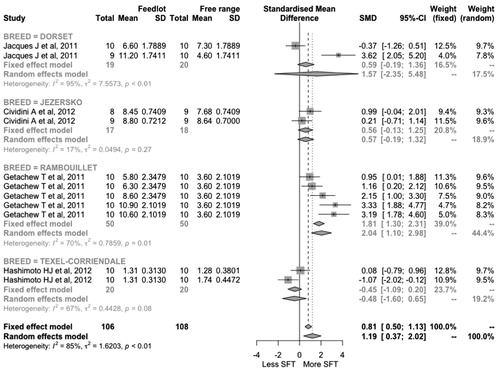
Table 2. Effect of the supplement on the carcase characteristics of lambs.
Table 3. Effect of the production system (feedlot or free-range) on the carcase characteristics in lambs.