
Figures & data
Figure 1. Relative quantification of the porcine CXCL8 mRNA level in seven different tissues. Bars represent the mean ± SE (n = 3). The values were normalised to GAPDH expression.
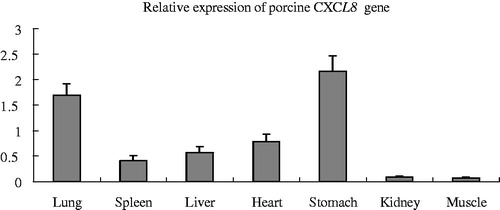
Table 1. Genotype frequencies and allelic frequencies of the SNP (NC_10450.4:g.69934997T > C, rs81218904) the CXCL8 gene determined by MALDI-TOFMS method in the three pig populations.
Table 2. Association analysis and multiple tests of the SNP (NC_010450.4:g.69934997T > C, rs81218904) of the CXCL8 gene with the serum CXCL8 level in the three pig populations.